-
Bug
-
Resolution: Unresolved
-
Critical
-
None
-
2.8 GA
-
20
-
Not Started
-
Not Started
-
Not Started
-
Not Started
-
Not Started
-
Not Started
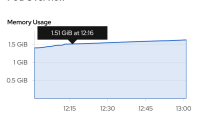
It was originally observed on a cluster created for internal customer: adp-integrations after ThreeScaleContainerHighMemory alert started to fire on the May 6th - 5 days after the cluster was created (and continues to fire till now): Screenshot 2020-05-12 at 16.03.44.png![]() .
.
As per the scaling sop [1], additional pod was added to the system-app DC, which in theory should decrease the memory usage of two already present pods. However, memory usage for existing system-app pods did not decrease: Screenshot 2020-05-13 at 13.02.09.png![]()
Memory usage for newly added pod also grows continuously and will more than likely be the same as two other pods within hours: Screenshot 2020-05-13 at 13.01.23.png![]()
There are no excessive logs in any of the system-app pod's containers
Potentially related (shared by rhn-support-keprice on chat):
https://issues.redhat.com/browse/THREESCALE-3397
https://issues.redhat.com/browse/THREESCALE-3792
Dev Notes
Using tools like
- https://github.com/schneems/derailed_benchmarks or ruby-prof (edited)
- https://github.com/ruby-prof/ruby-prof
- https://github.com/tmm1/stackprof
- https://rbspy.github.io/
- https://github.com/SamSaffron/memory_profiler
If QE needs to test this, please share how to do that and/or help them as needed.
So these tools only tell you what is growing and which objects are created but do not tell you where those objects come from.
So you need to find the origin of those leaks given the pattern found above
You will need to deploy the application and feed it some traffic
- is related to
-
THREESCALE-401 Upgrade to Liquid 4.x (Originally "no official reference for Liquid 3.x")
-
- Closed
-
-
THREESCALE-5010 Upgrade to Rails 5.1
-
- Closed
-
- relates to
-
THREESCALE-6316 Upgrade to rails 5.2.z
-
- Closed
-


