-
Bug
-
Resolution: Unresolved
-
 Minor
Minor
-
COO 1.1.0
-
None
-
Quality / Stability / Reliability
-
False
-
-
1
-
Moderate
-
None
-
None
-
Sprint 272, Sprint 273
-
None
-
None
-
None
- OCP 4.18
- COO1.1 installed thru this https://docs.google.com/document/d/1-xN6y3VZbKrDOHpuTVlsT2MnGiDjYIl5qM6TNwQnLHo/edit?tab=t.l57owzgyn120 using last konflux image:
quay.io/redhat-user-workloads/cluster-observabilit-tenant/cluster-observability-operator/coo-fbc-v4-18@sha256:9c9ceb919365db44766b3a2bf473d48f1905d02f41178e91000dc03830a85e0b
3. Perses Dashboard
https://github.com/perses/perses-operator/blob/078cf1f8fb1ab5d8653c1e043ac401abf46a19fc/config/samples/openshift/openshift-cluster-sample-dashboard.yaml
4. Perses datasource
apiVersion: perses.dev/v1alpha1
kind: PersesDatasource
metadata:
  name: thanos-querier-datasource
spec:
  display:
    name: "Thanos Querier Datasource"
  default: true
  plugin:
    kind: "PrometheusDatasource"
    spec:
      directUrl: "https://console-openshift-console.apps.emurasak-418.qe.devcluster.openshift.com/api/prometheus"
5. Install Monitoring UIPlugin with Perses enabled (in my scenario I also have ACM and Incidents)
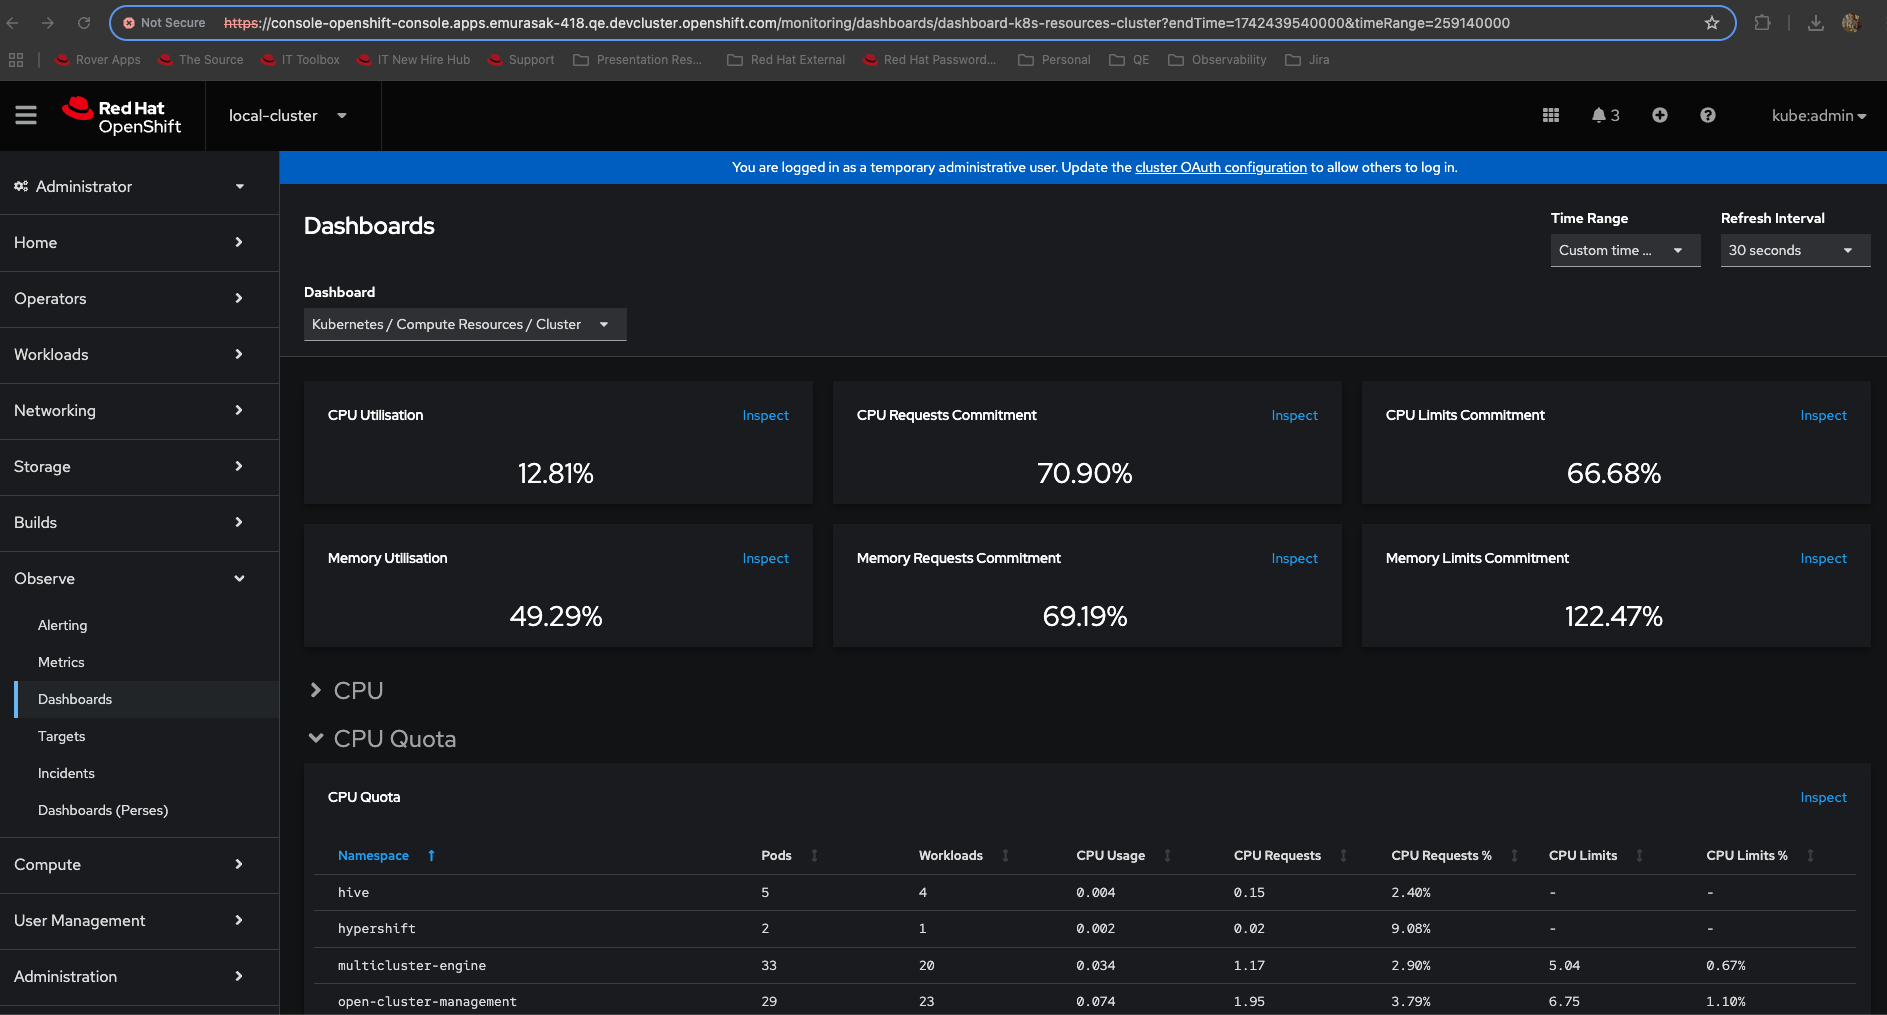
6. Go To Observe > Dashboards for comparison
7. Select Kubernetes / Compute Resources / Cluster
8. Collapse CPU section to look directly to CPU Quota - it is a table format
9. Change Time Range = Custom time range
10. From = yesterday, leave all other fields as is
11. Click on Save => (notice you will need to repeat it, bc it assumes the last chosen option instead of this custom time range you just did it - I will open other defect) Dashboard is quickly refreshed and CPU Quota is still showing numbers

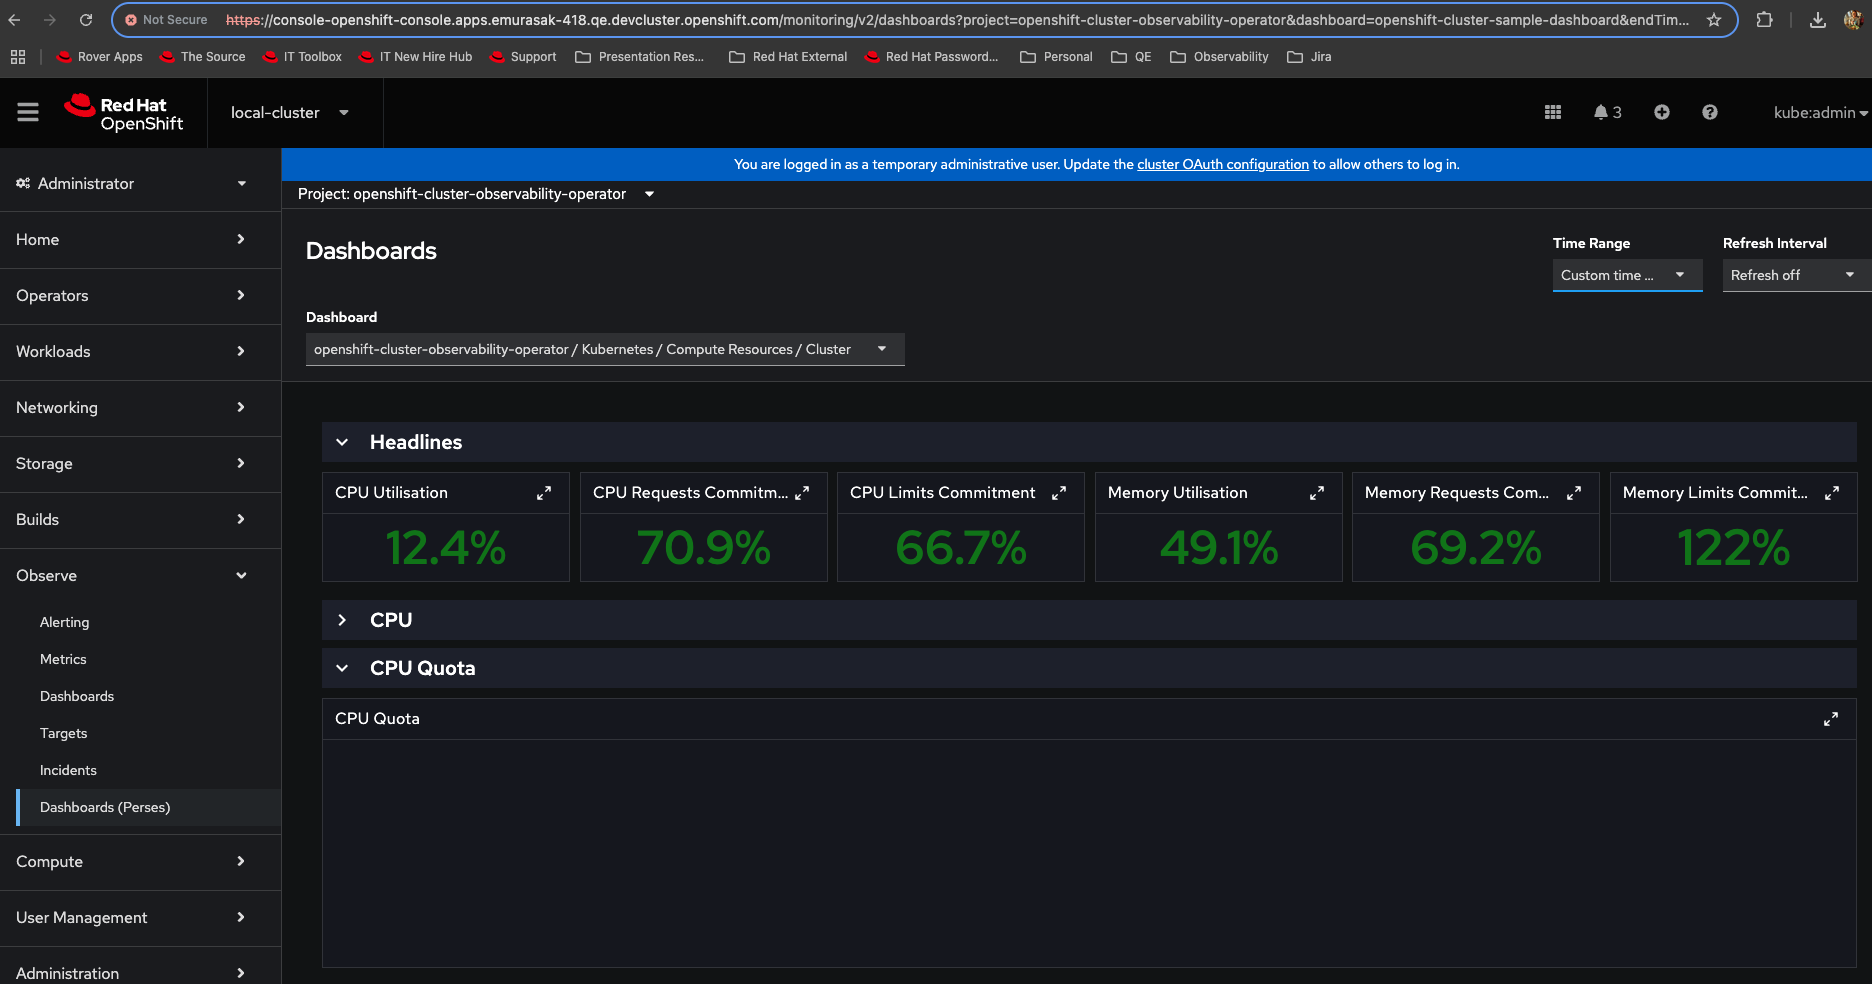
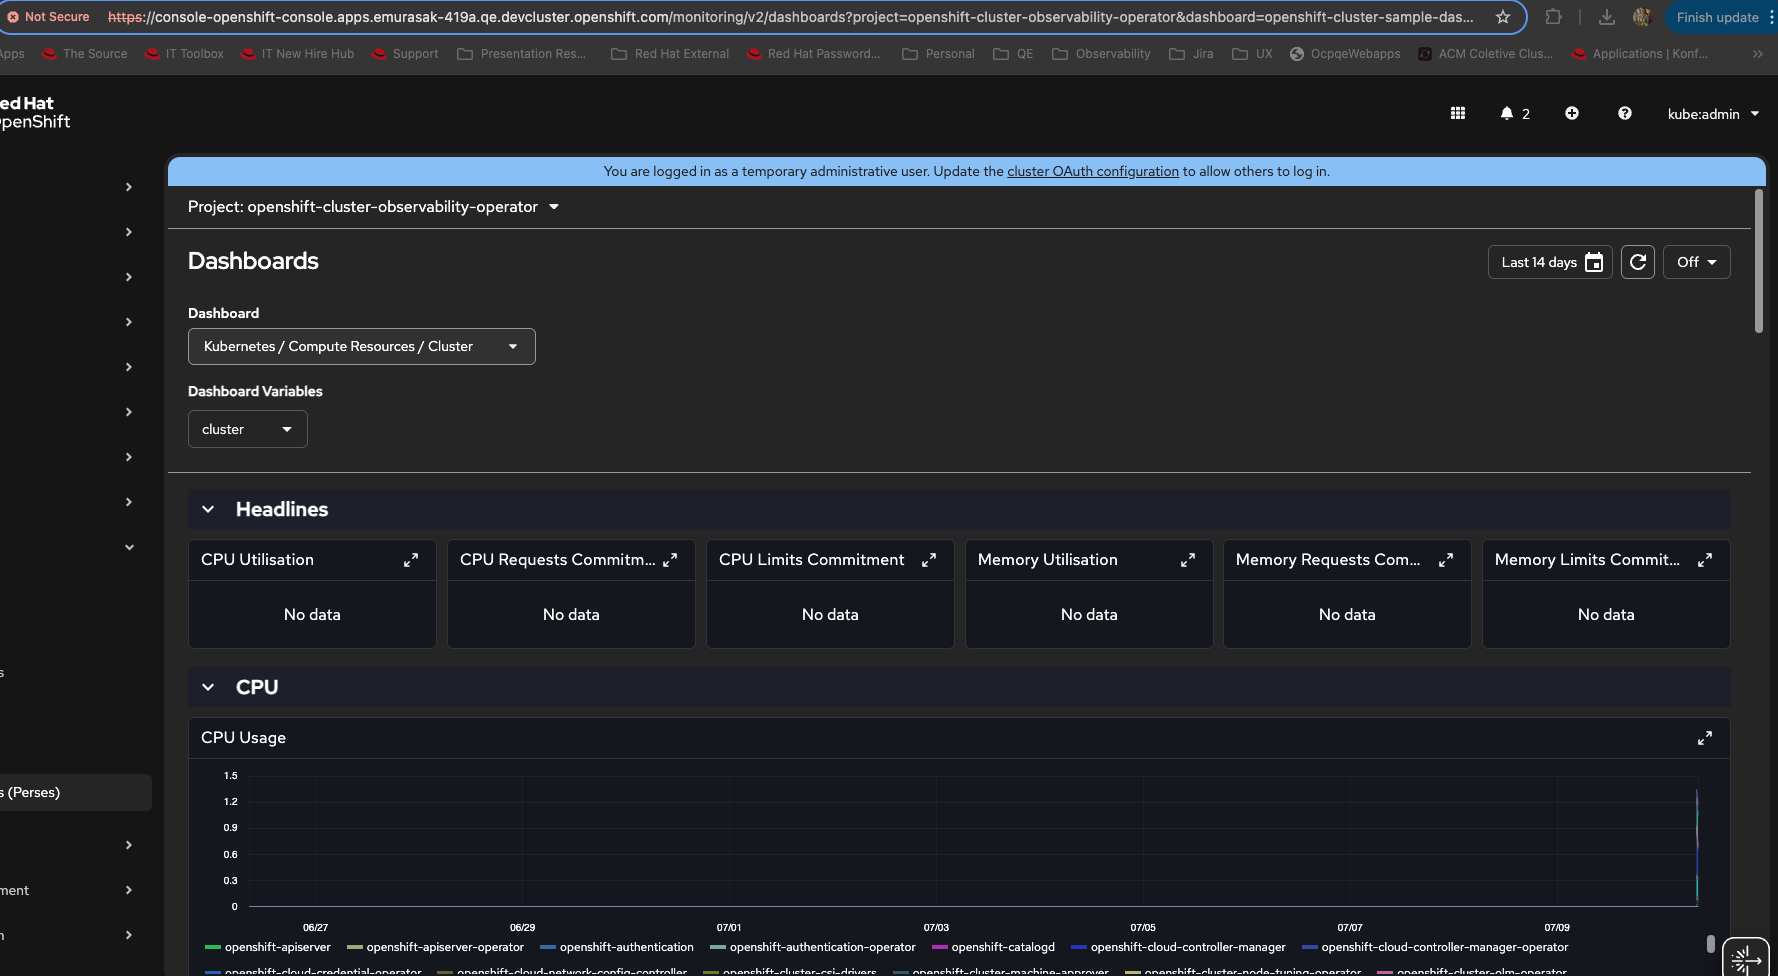
12. Go To Observe > Dashboards (Perses)
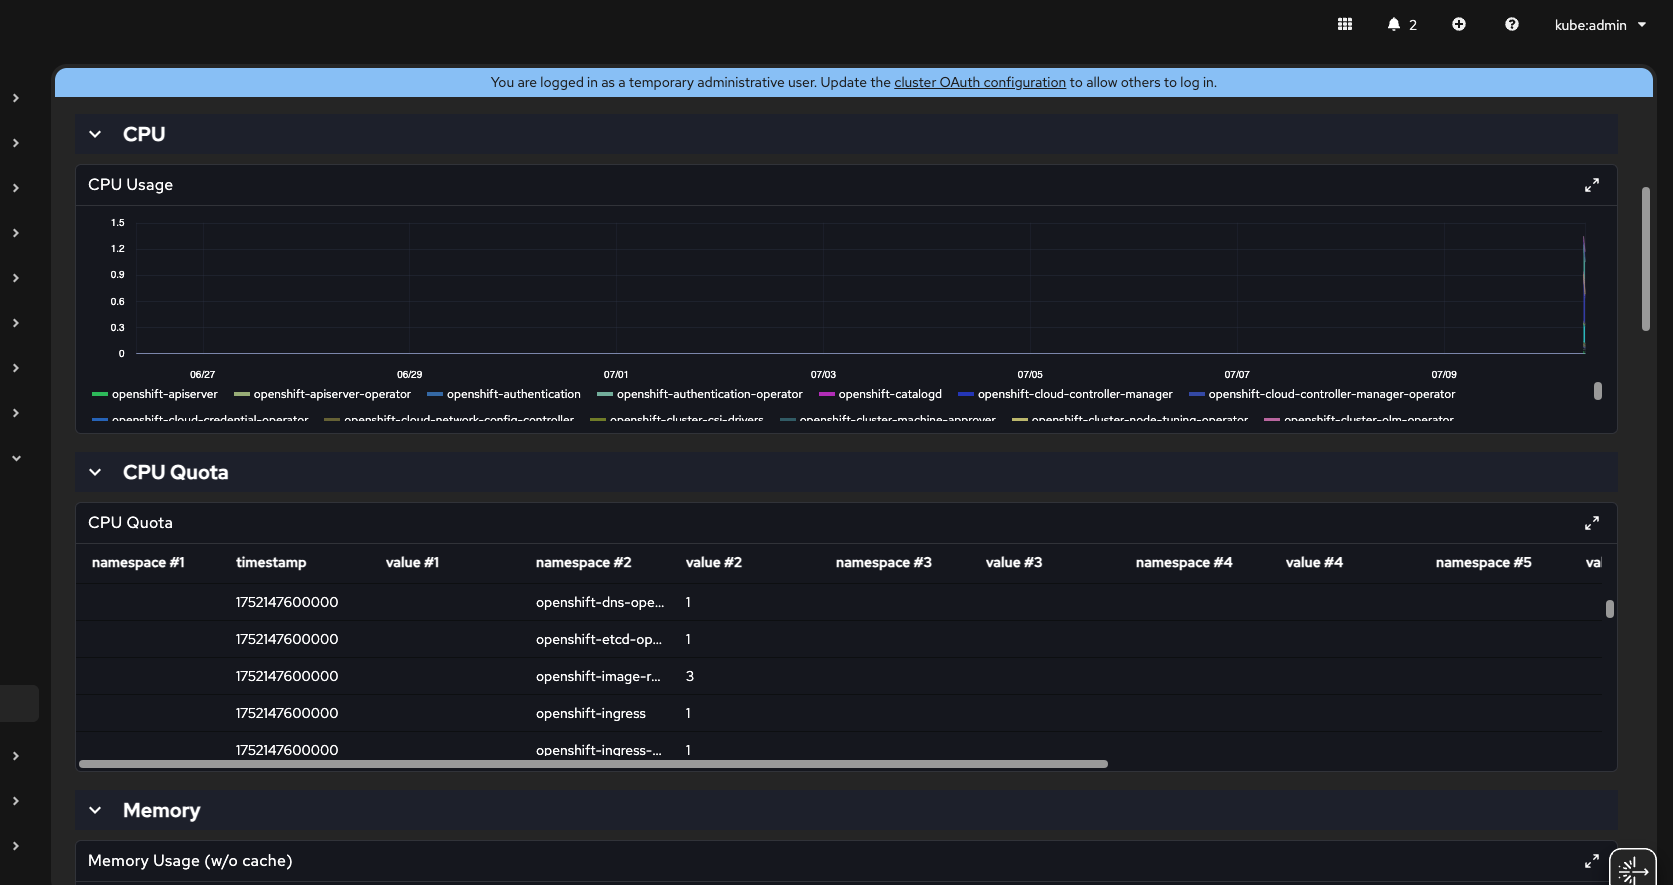
13. Collapse CPU and look at CPU Quota
14. Change Time Range to Custom time range and choose From = Yesterday and save it
Actual Result: CPU Quota is just an example. Other tables are also empty

- is cloned by
-
-

- Verified
-
-
-
- Closed
-
- is related to
-
COO-735 Perses operator and monitoring perses dashboard
-

- Closed
-
- relates to
-
OU-679 Test COO 1.1.0 Perses
-
- Closed
-