-
Bug
-
Resolution: Won't Do
-
 Minor
Minor
-
COO 1.1.0
-
None
-
Quality / Stability / Reliability
-
False
-
-
1
-
Moderate
-
None
-
None
-
Sprint 272, Sprint 284
-
None
-
None
-
None
- OCP 4.18
- COO1.1 installed thru this https://docs.google.com/document/d/1-xN6y3VZbKrDOHpuTVlsT2MnGiDjYIl5qM6TNwQnLHo/edit?tab=t.l57owzgyn120 using last konflux image:
quay.io/redhat-user-workloads/cluster-observabilit-tenant/cluster-observability-operator/coo-fbc-v4-18@sha256:9c9ceb919365db44766b3a2bf473d48f1905d02f41178e91000dc03830a85e0b
3. Perses Dashboard
https://github.com/perses/perses-operator/blob/078cf1f8fb1ab5d8653c1e043ac401abf46a19fc/config/samples/openshift/openshift-cluster-sample-dashboard.yaml
4. Perses datasource
apiVersion: perses.dev/v1alpha1
kind: PersesDatasource
metadata:
  name: thanos-querier-datasource
spec:
  display:
    name: "Thanos Querier Datasource"
  default: true
  plugin:
    kind: "PrometheusDatasource"
    spec:
      directUrl: "https://console-openshift-console.apps.emurasak-418.qe.devcluster.openshift.com/api/prometheus"
5. Install Monitoring UIPlugin with Perses enabled (in my scenario I also have ACM and Incidents)
6. Go To Observe > Dashboards for comparison
7. Select Kubernetes / Compute Resources / Cluster
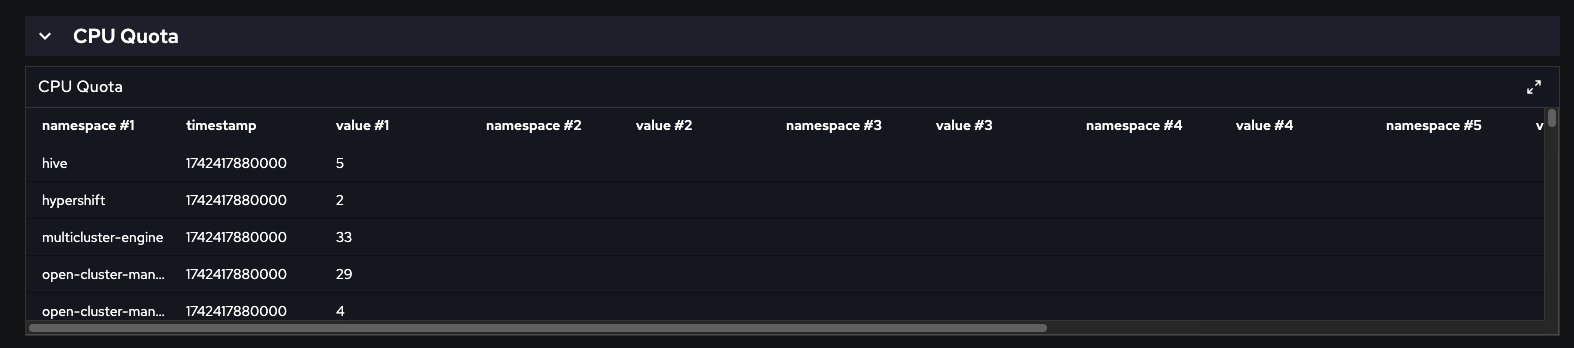
8. Collapse CPU section to look directly to CPU Quota - it is a table format
9. Verify CPU Quota table header
Actual Result: It is show namespace #1, value #1, namespace #2

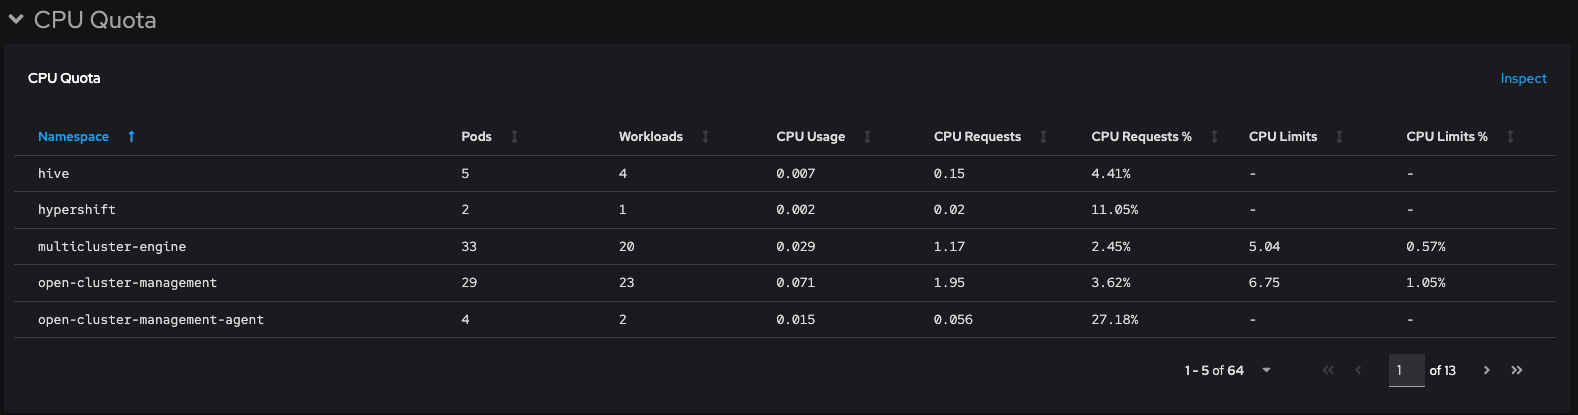
While in old Dashboard we have Pods, Workloads, CPU Usage

This defect is also applicable to other tables: Memory Requests, Current Network Usage, Storage IO - Distribution