-
Bug
-
Resolution: Unresolved
-
 Normal
-
COO 1.1.0
-
None
-
Quality / Stability / Reliability
-
False
-
-
None
-
Moderate
-
None
-
None
-
None
-
None
-
None
-
None
- OCP 4.18
- ACM installed with Multicluster
- COO1.1 installed thru this https://docs.google.com/document/d/1-xN6y3VZbKrDOHpuTVlsT2MnGiDjYIl5qM6TNwQnLHo/edit?tab=t.l57owzgyn120 using last konflux image:
quay.io/redhat-user-workloads/cluster-observabilit-tenant/cluster-observability-operator/coo-fbc-v4-18@sha256:9c9ceb919365db44766b3a2bf473d48f1905d02f41178e91000dc03830a85e0b
3. Perses Dashboard
https://github.com/perses/perses-operator/blob/078cf1f8fb1ab5d8653c1e043ac401abf46a19fc/config/samples/openshift/openshift-cluster-sample-dashboard.yaml
4. Perses datasource
apiVersion: perses.dev/v1alpha1
kind: PersesDatasource
metadata:
  name: thanos-querier-datasource
spec:
  display:
    name: "Thanos Querier Datasource"
  default: true
  plugin:
    kind: "PrometheusDatasource"
    spec:
      directUrl: "https://console-openshift-console.apps.emurasak-418.qe.devcluster.openshift.com/api/prometheus"
5. Install Monitoring UIPlugin with ACM enabled (in my scenario I also have Perses and Incidents)
6. Choose All Clusters
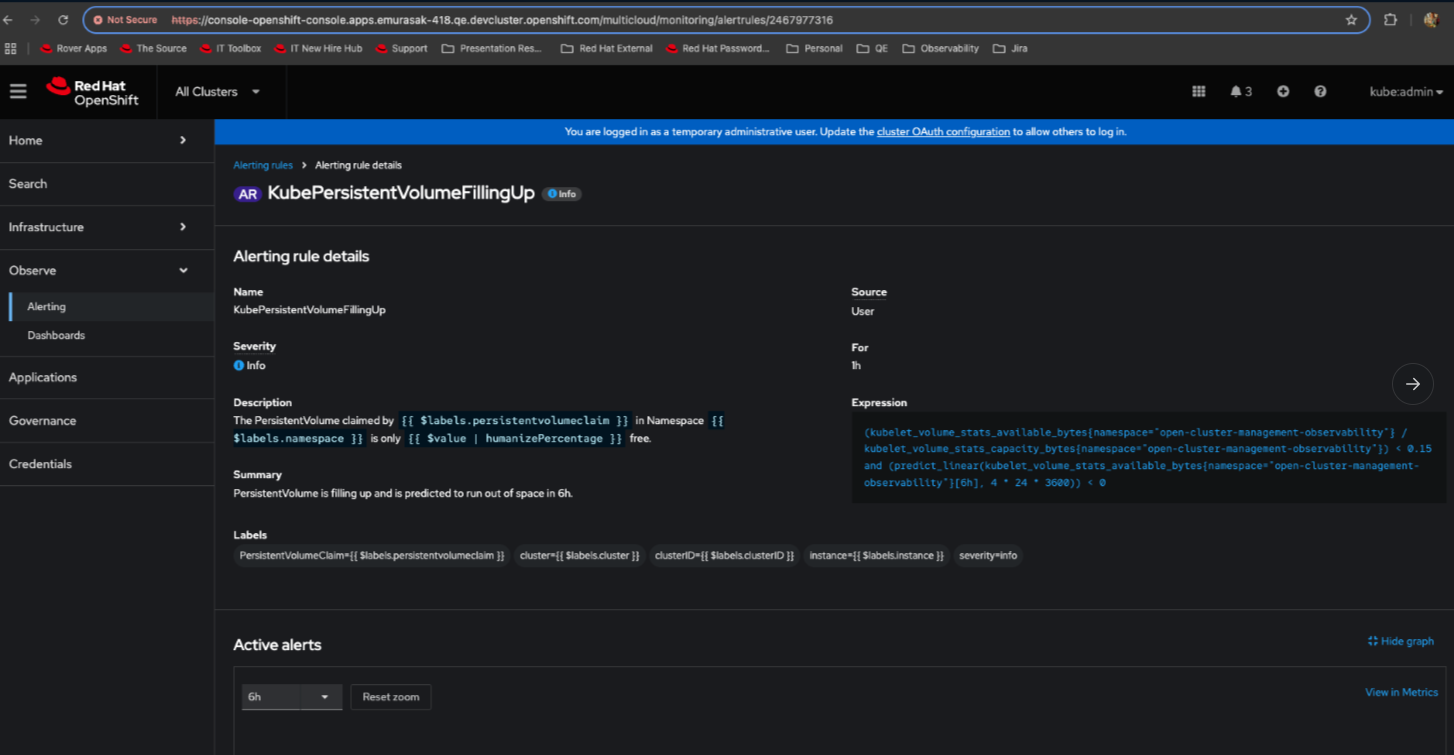
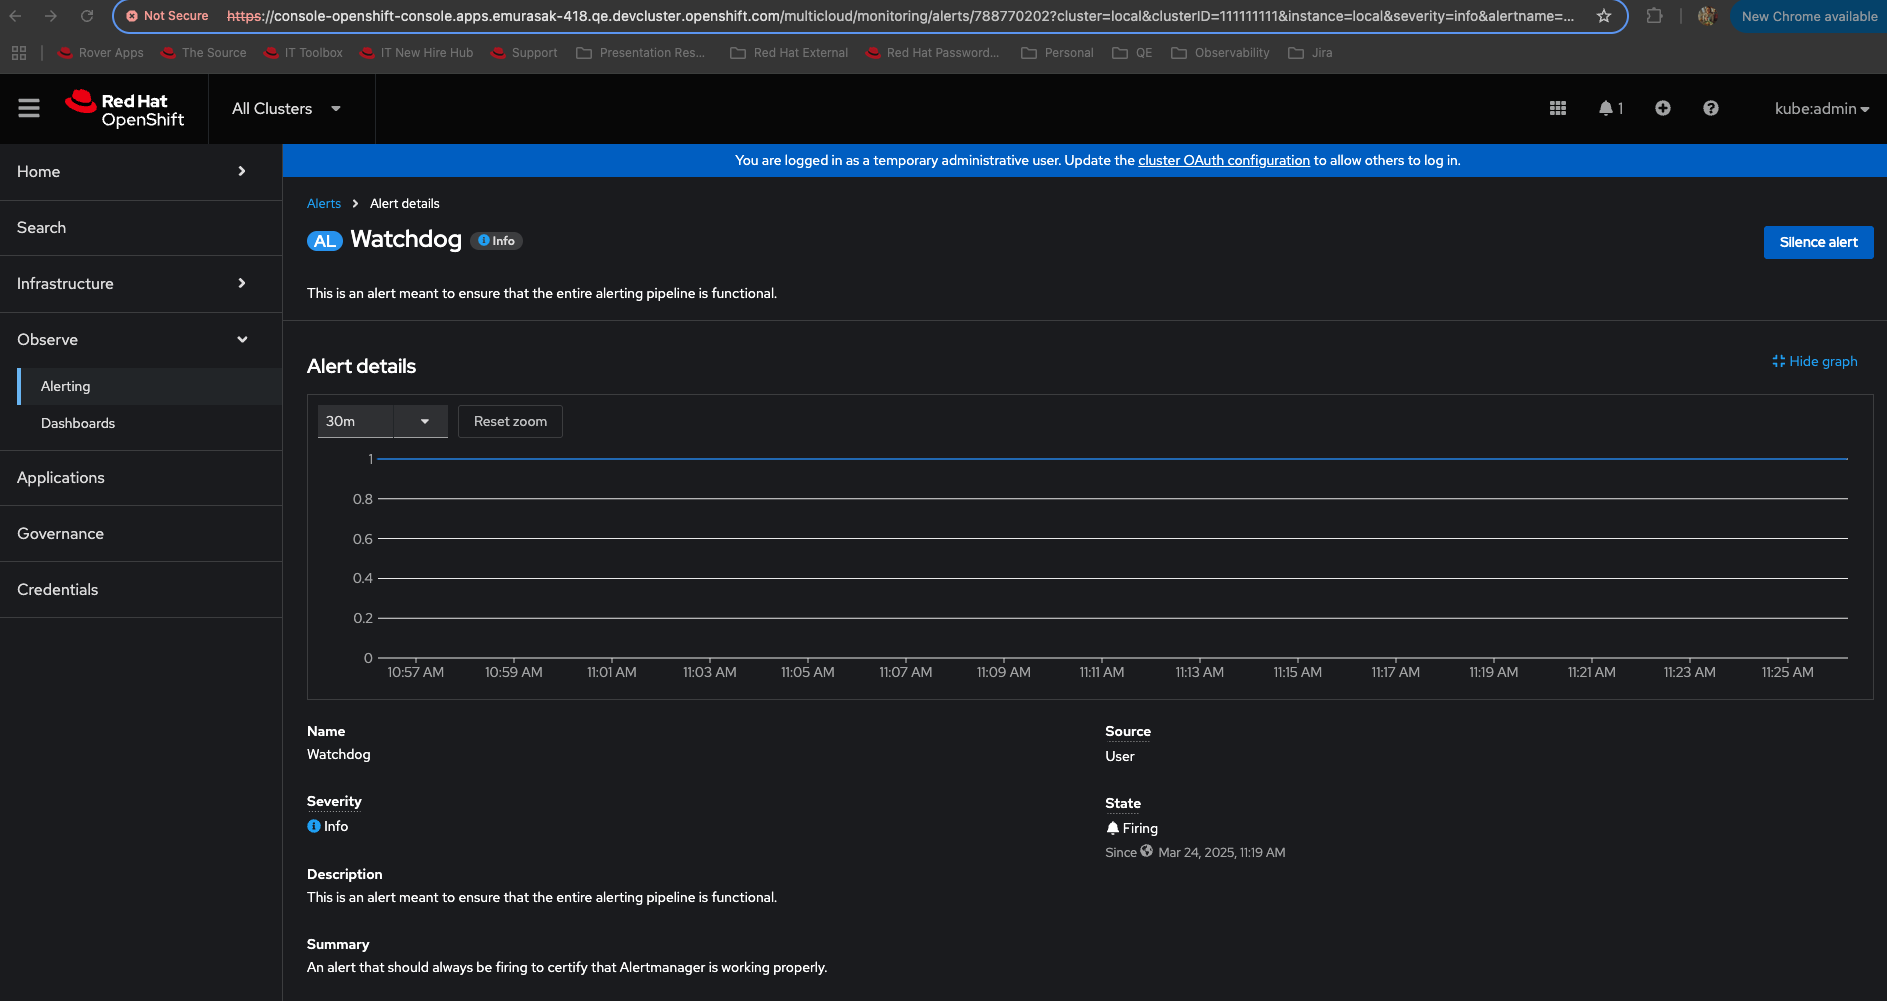
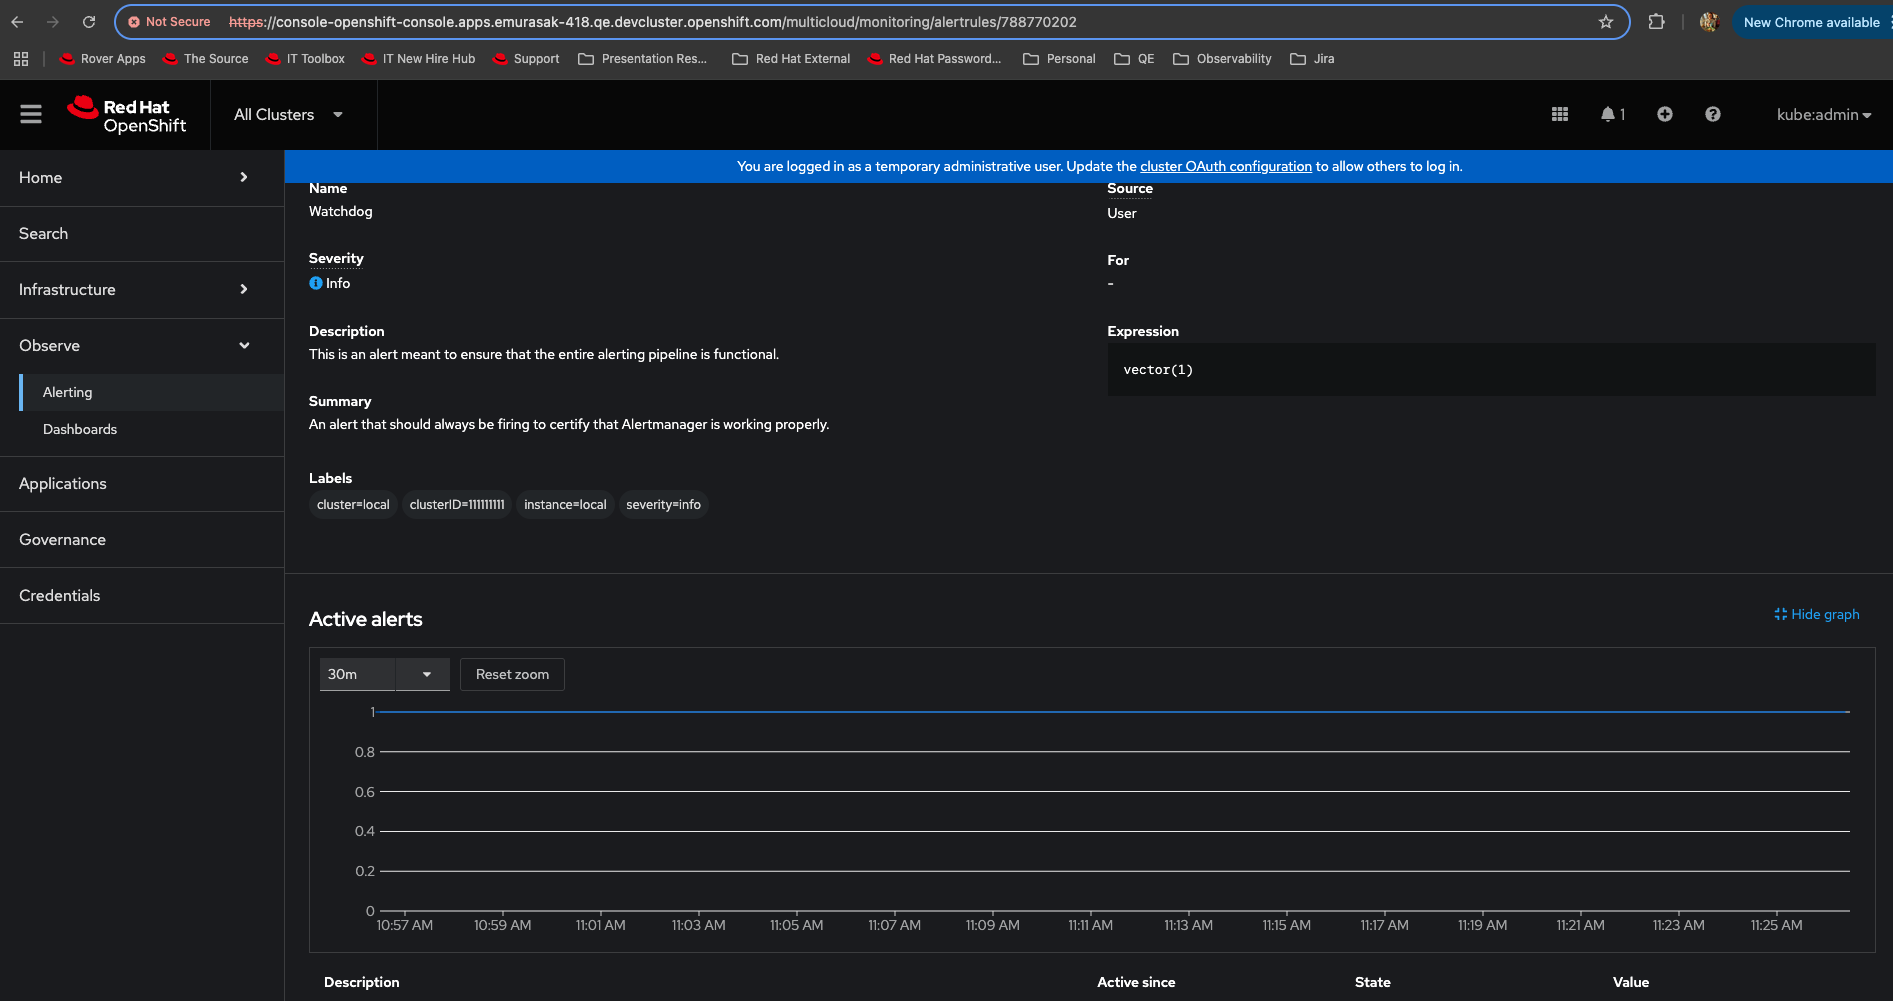
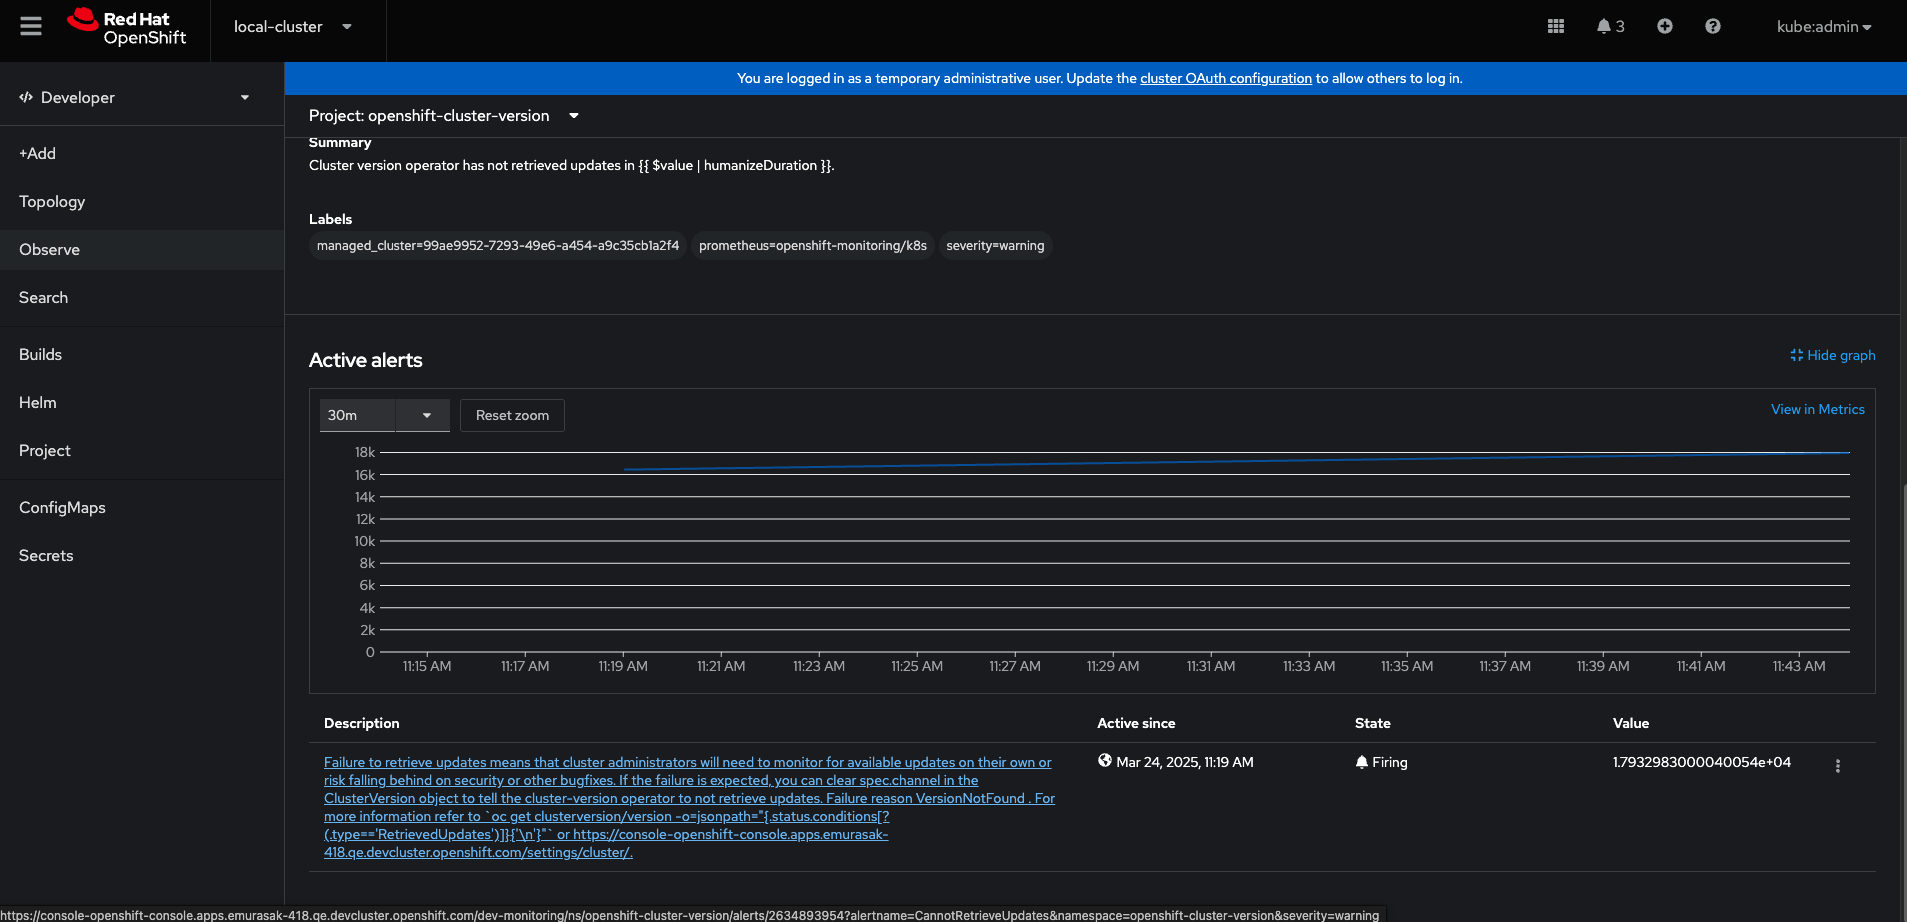
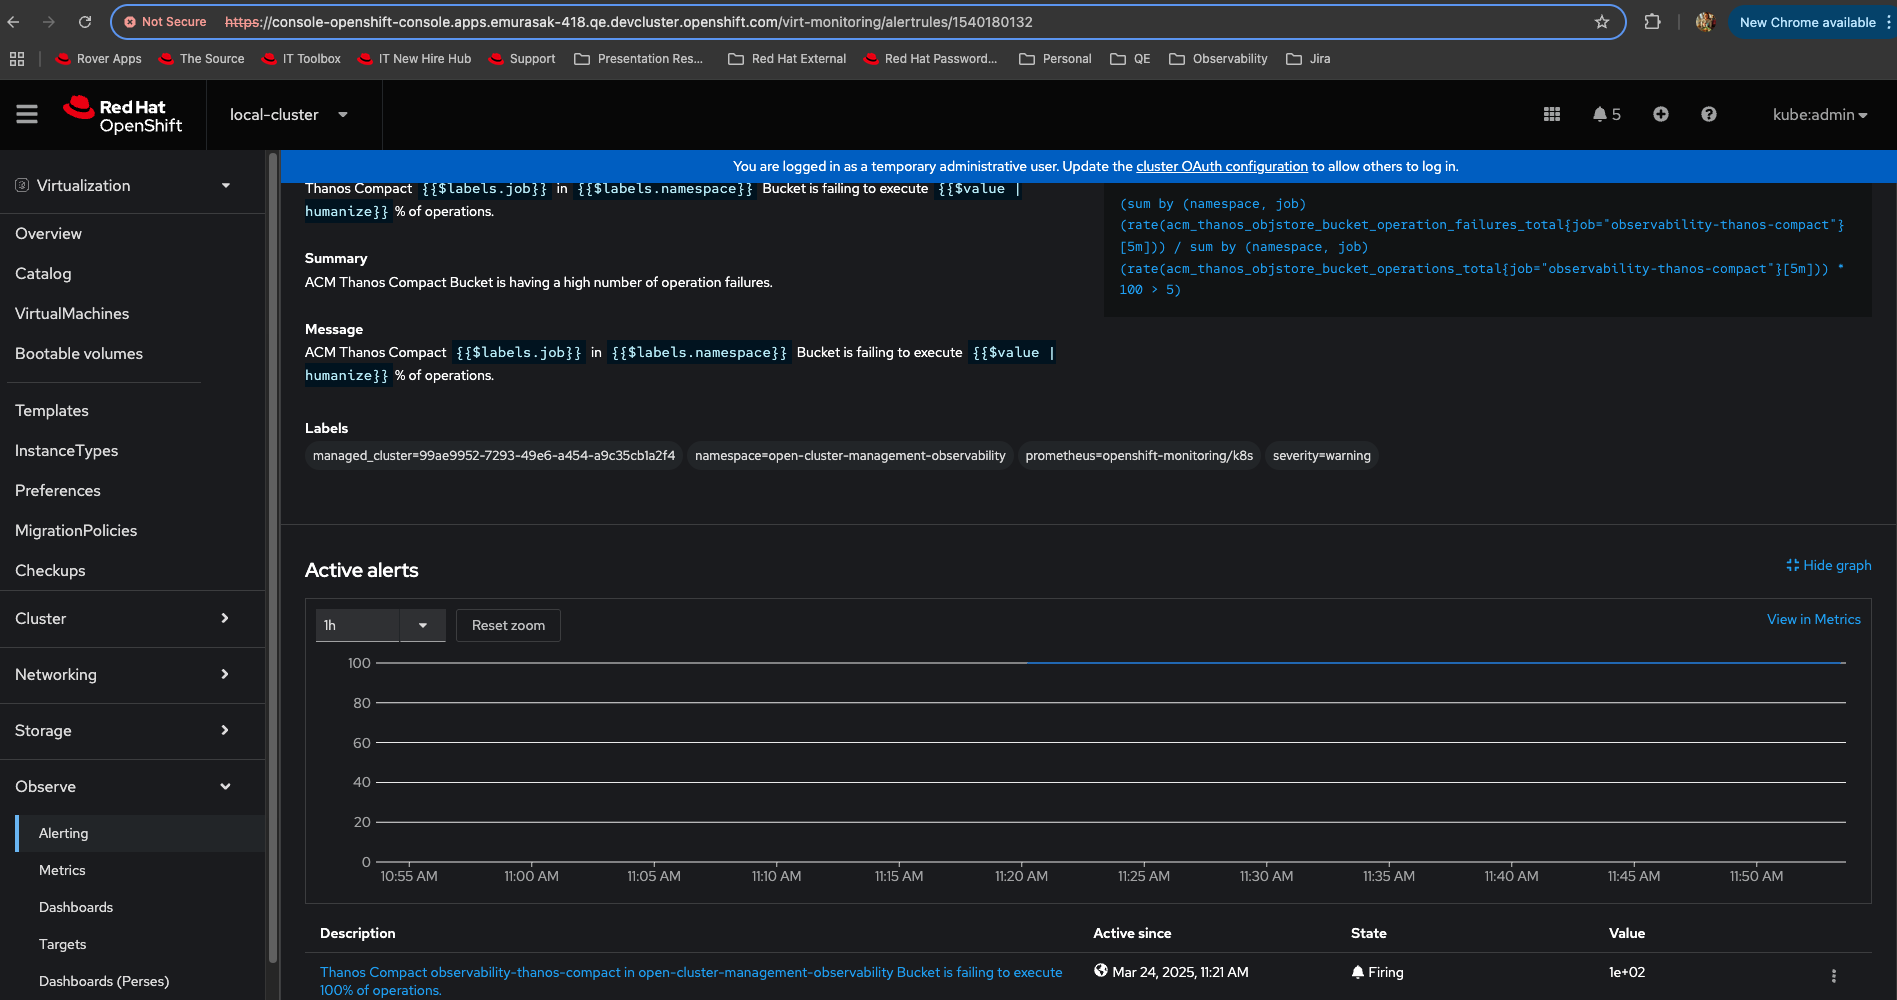
7. Go To Observe > Alerting (I couldn't inject alerts) > Alerting rule
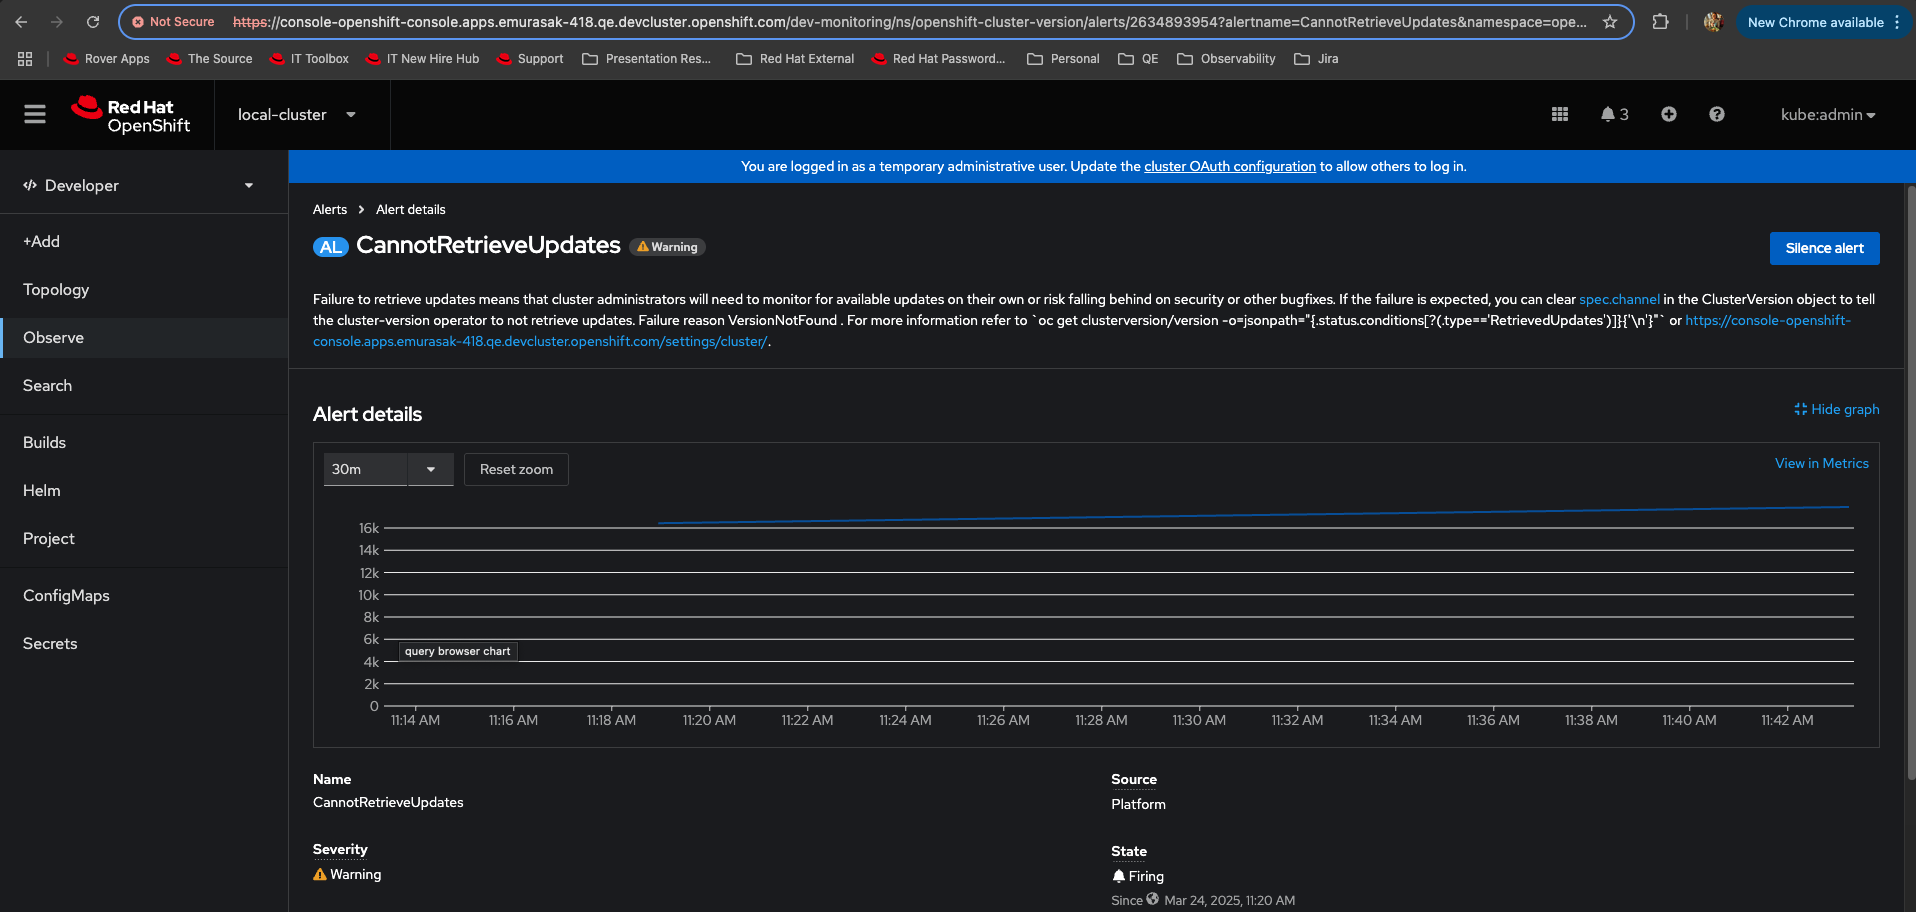
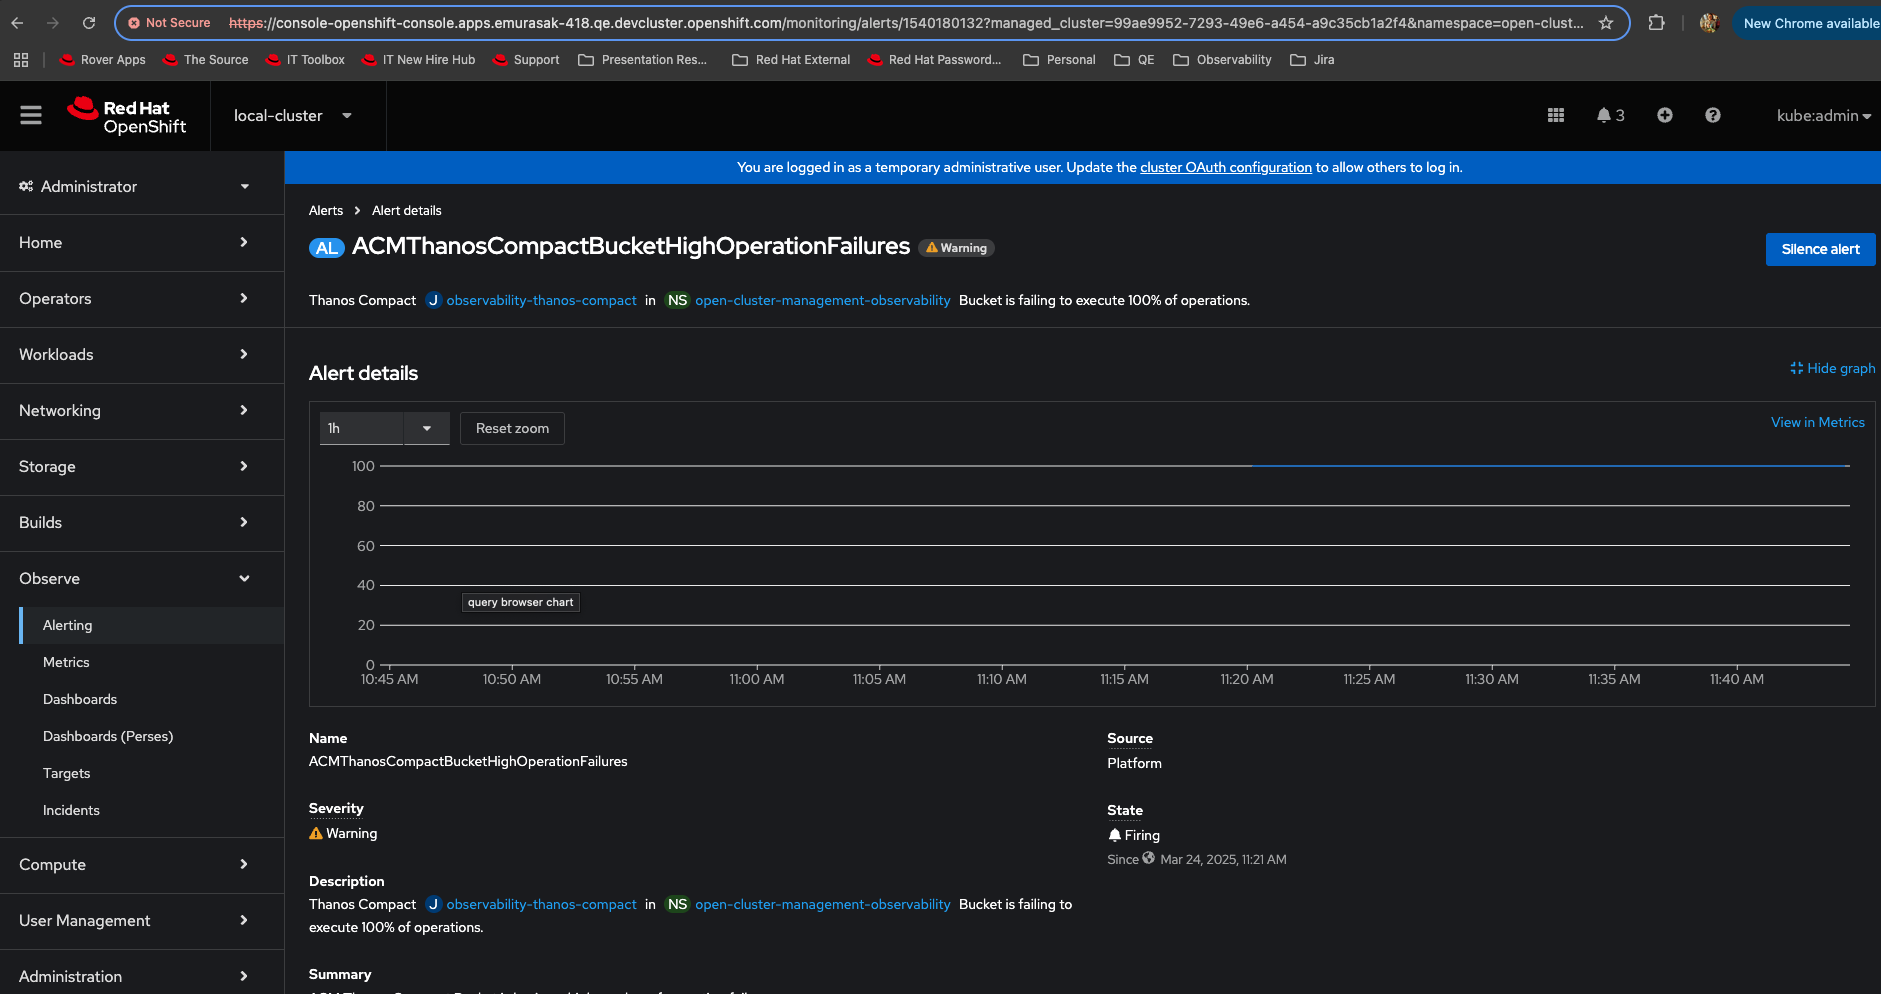
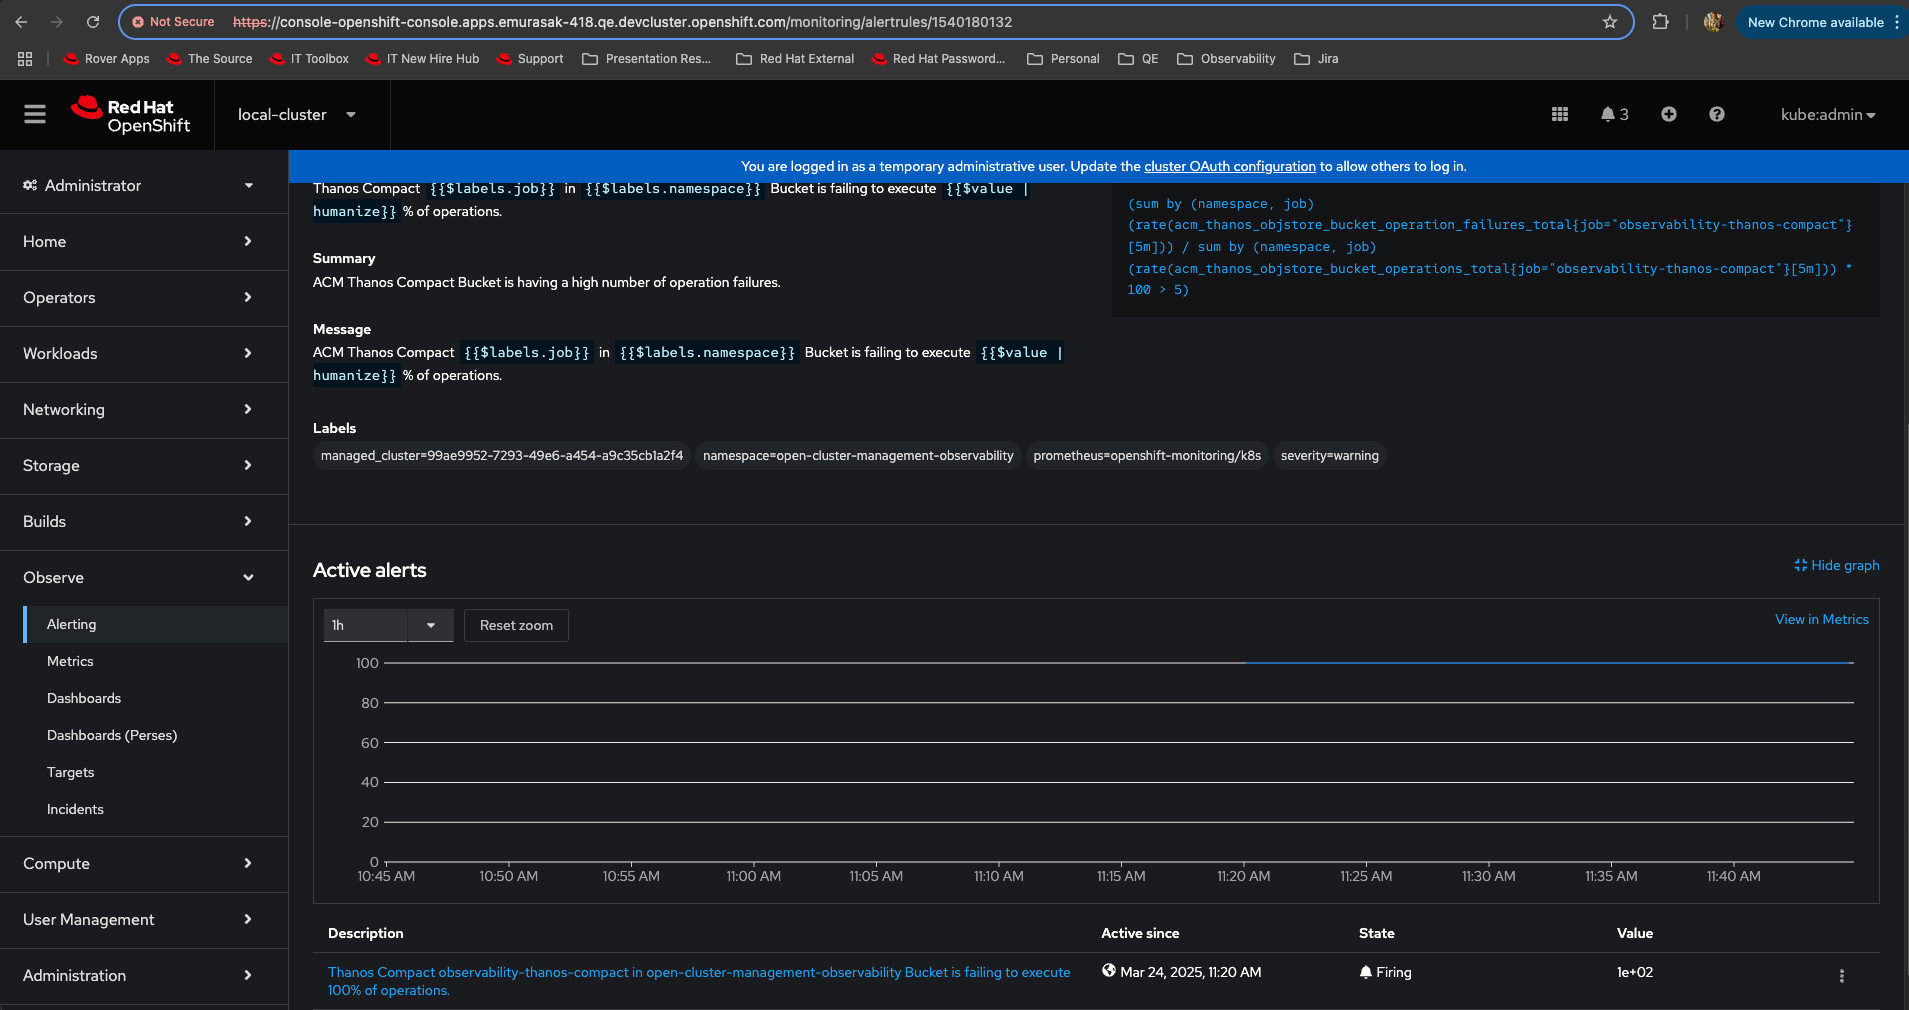
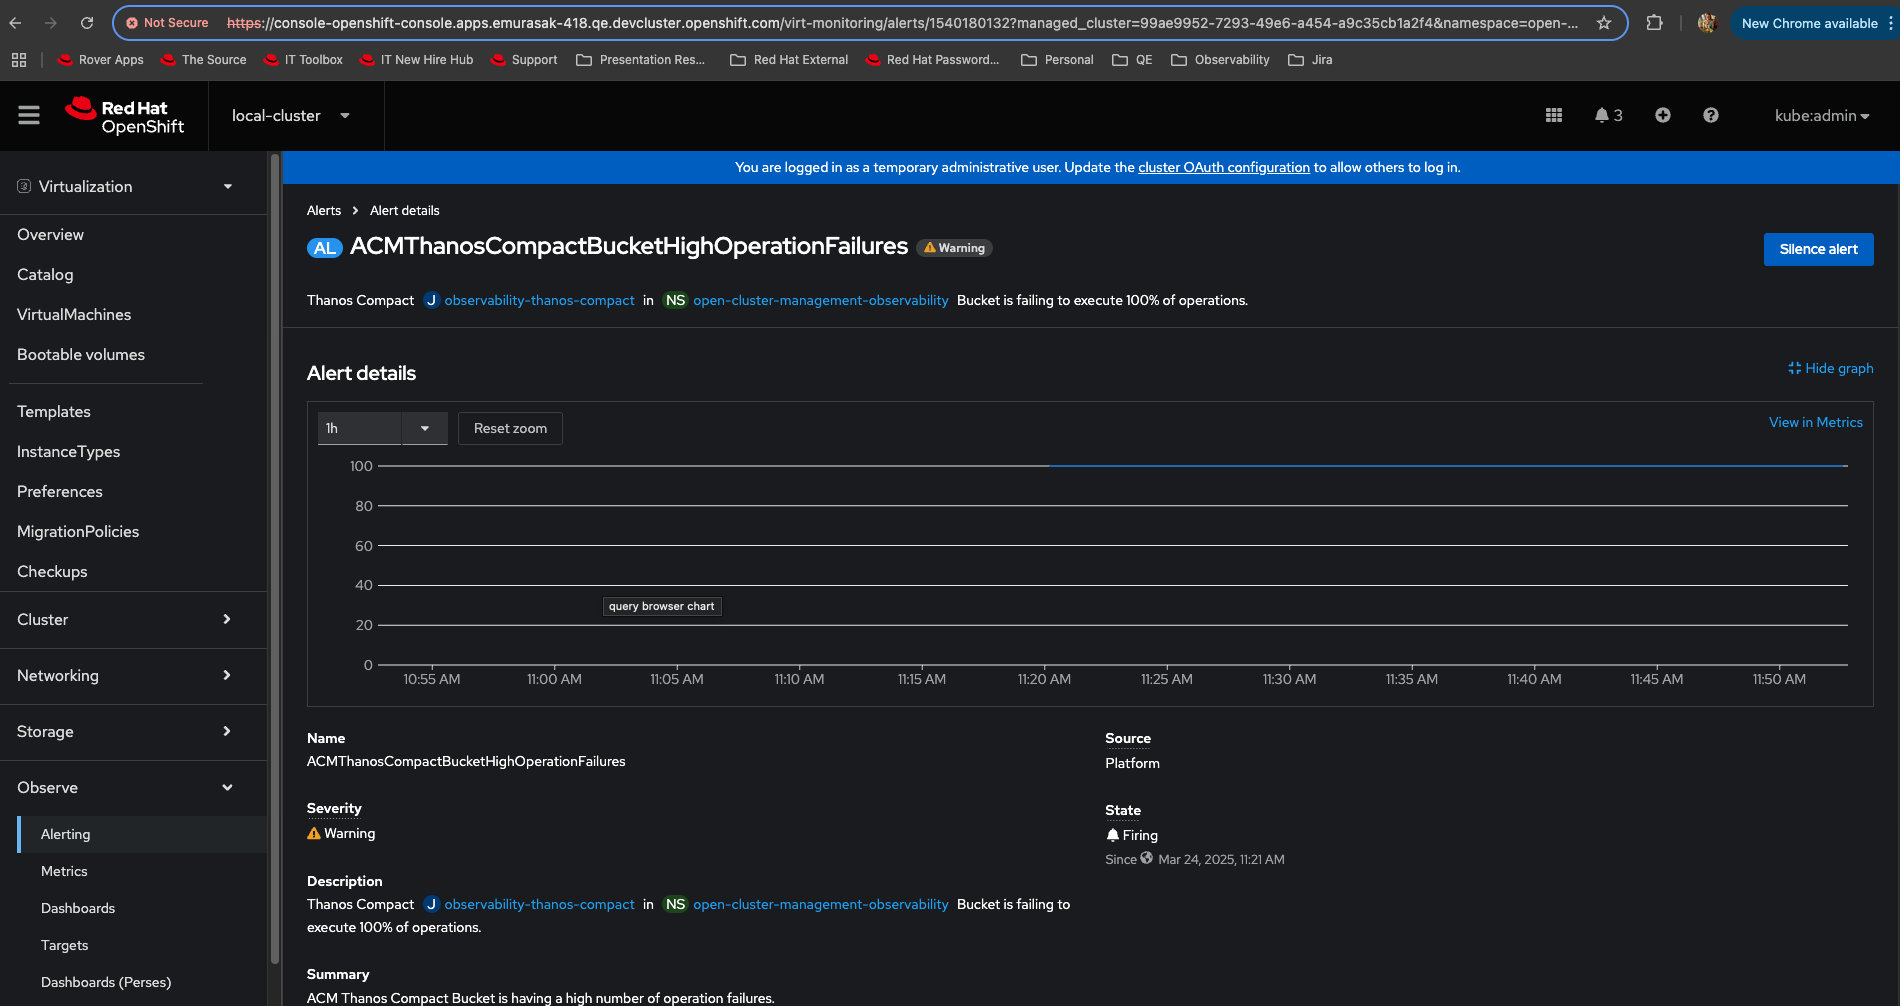
8. In the graph, verify View in Metrics link
Actual Result: View in Metrics link is visible. When you click, it redirects you to Infrastructure menu.

Expected Result: View in Metrics should not be visible.
- clones
-
-

- Verified
-
- is related to
-
COO-724 [QE] COO UI checking
-

- Closed
-
-
-
- Closed
-
- relates to
-
-
- Closed
-
-
OU-679 Test COO 1.1.0 Perses
-
- Closed
-
- links to