Uploaded image for project: 'Observability UI'
  1. Observability UI
  2. OU-169

CPU Usage dashboard displays wrong information

XMLWordPrintable

    • 3
    • False
    • Hide

      None

      Show
      None
    • False
    • NEW
    • NEW
    • Sprint 235

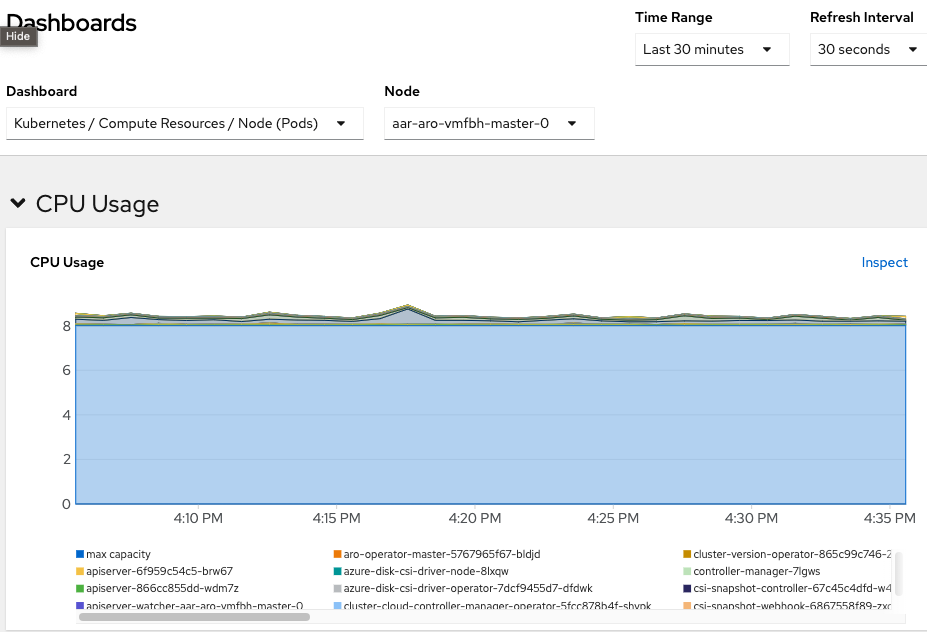
      In the CPU Usage dashboard the stack check is enabled by default but a line chart should be used instead. Stacking the values sums all the values with the max value giving the impression of a high resource usage.

      How to reproduce

      • Go to the OCP console and check in the observe -> dashboards
      • Select the Kuberentes -> resources -> Nodes (Pod)

      Reproducible:

      • Always

            jezhu@redhat.com Jenny Zhu
            gbernal@redhat.com Gabriel Bernal
            Votes:
            0 Vote for this issue
            Watchers:
            3 Start watching this issue

              Created:
              Updated:
              Resolved: