-
Bug
-
Resolution: Done
-
Normal
-
None
-
4.11.z
-
None
-
Quality / Stability / Reliability
-
False
-
-
None
-
Low
-
None
-
None
-
None
-
None
-
None
-
Bug Fix
-
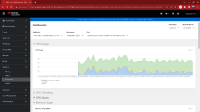
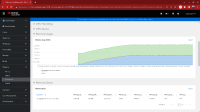
In the monitoring dashboard under Kubernetes/Compute Resources/, all metrics on diagrams "CPU Usage" and "Memory Usage" are shown in an unstacked way.
-
None
-
None
-
None
-
None
Description of problem:
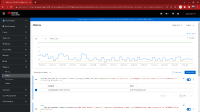
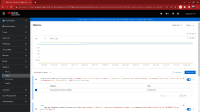
While viewing resource consumption for a specific pod, several graphes are stacked that should not be. For example cpu/memory limits are a static value and thus should be a static line across a graph. However when viewing the Kubernetes / Compute Resources / Pod Dashboard I see limits are stacked above the usage. This applies to both CPU and Memory Usage graphs on this dashboard. When viewing the graph via inspect the visualization seems "fixed".
Version-Release number of selected component (if applicable):
OCP 4.11.19
How reproducible:
Steps to Reproduce:
1.
2.
3.
Actual results:
Expected results:
Additional info:
At the current version 4.12 Openshift console cannot mix both stacked metrics with unstacked metrics on the same chart.
The fix is to unstack metrics on charts having some limit markers such as request, limit, etc.
- clones
-
OCPBUGS-14656 With OpenShift Web Console Dashboards in 4.12, memory limits and requests are not overlayed
-
- Closed
-
- is cloned by
-
OCPBUGS-12727 Backport OCPBUGS-5353: Dashboard graph should not be stacked - Kubernetes / Compute Resources / Pod Dashboard
-
- Closed
-
- is depended on by
-
OCPBUGS-12727 Backport OCPBUGS-5353: Dashboard graph should not be stacked - Kubernetes / Compute Resources / Pod Dashboard
-
- Closed
-
- is duplicated by
-
OU-169 CPU Usage dashboard displays wrong information
-
- Closed
-
- links to


