-
Bug
-
Resolution: Duplicate
-
Undefined
-
None
-
None
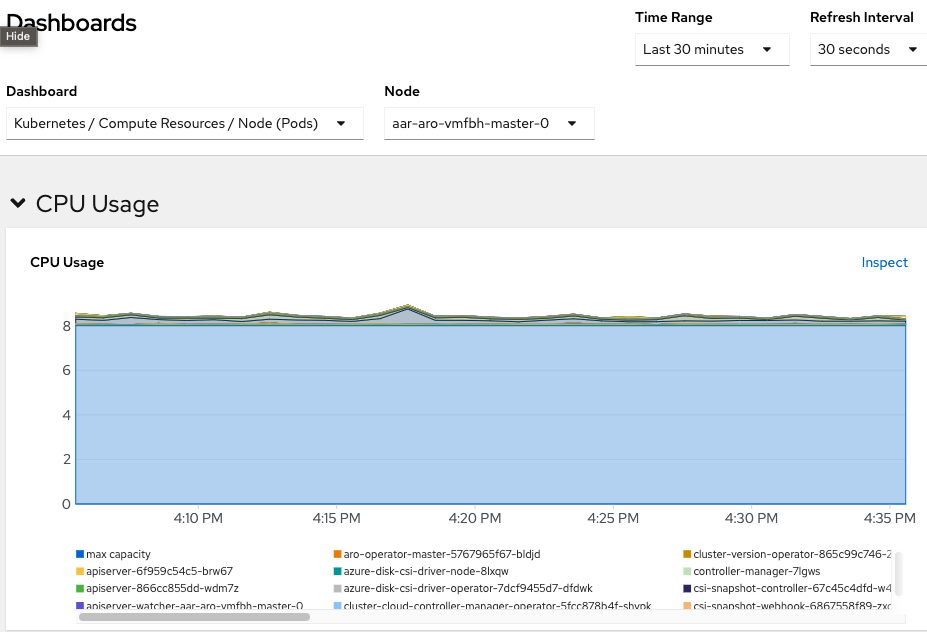
In the CPU Usage dashboard the stack check is enabled by default but a line chart should be used instead. Stacking the values sums all the values with the max value giving the impression of a high resource usage.
How to reproduce
- Go to the OCP console and check in the observe -> dashboards
- Select the Kuberentes -> resources -> Nodes (Pod)
Reproducible:
- Always

- duplicates
-
OCPBUGS-5353 Dashboard graph should not be stacked - Kubernetes / Compute Resources / Pod Dashboard
-
- Closed
-
