-
Feature Request
-
Resolution: Unresolved
-
 Normal
-
None
-
None
-
False
-
-
False
-
Not Selected
As possible in Grafana, the feature to correlate Metrics exemplars with traces and traces with logs is highly interesting for customers as well as supporting the korrel8r from rhn-engineering-aconway
Even though OpenShift Monitoring might not scrape exemplars at the moment, technically we are able to scrape them with the OpenShift Monitoring stack since 4.16.
From the experience and use of these correlations with Grafana, it's mandatory to understand that custom queries to correlate are highly appreciated compared to hardcoded lookups
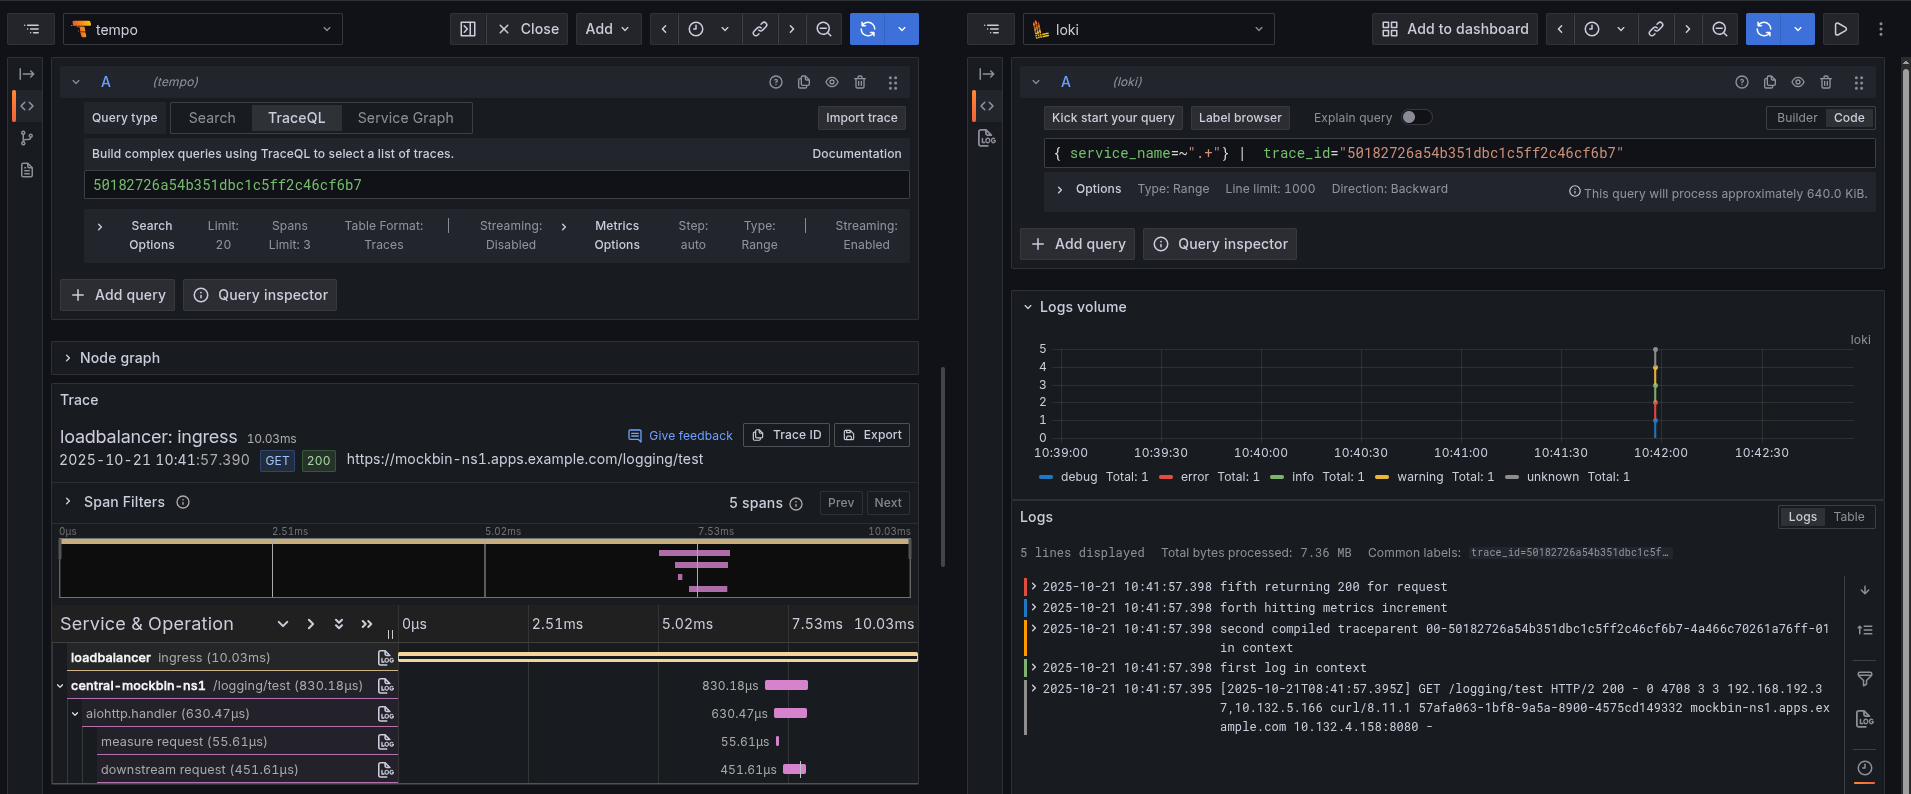
A possible query from traces to logs could look like
{ service_name=~".+"} | trace_id="${__span.traceId}"
which removes the burden of guessing compared to time-range based correlation.
One perfect use-case of such correlation already possible is OpenShift ServiceMesh which provides metrics, traces and logs with build-in envoy correlation
The screenshot from Grafana below provides the `Log` icon which executes the query towards Loki for one. A similar style in OpenShift UIPlugin is what we are looking for.

- is cloned by
-
TRACING-5825 TraceID is all capitalized which makes it useless for copy&paste queries
-
- Release Pending
-