Uploaded image for project: 'Red Hat 3scale API Management'
  1. Red Hat 3scale API Management
  2. THREESCALE-7952

Document descriptions of Grafana charts that are deployed by 3scale-operator

XMLWordPrintable

    • 3
    • False
    • False
    • Not Started
    • Not Started
    • Not Started
    • Not Started
    • Not Started
    • Not Started

      When monitoring is enabled, 3scale-operator deploys Grafana dashboards.
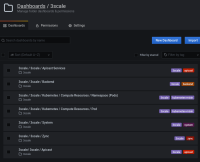
      However, there's no definition for each chart. For example, what is the difference between HTTP connections (global) and HTTP connections (All) in APIcast dashboard?
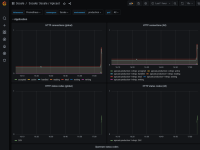
      Please document the description of each chart.

        1. apicast_charts.png
          82 kB
          Takayuki Konishi
        2. dashboards.png
          87 kB
          Takayuki Konishi
        3. prometheus_rules.png
          53 kB
          Takayuki Konishi
        4. rule_details.png
          45 kB
          Takayuki Konishi

              Unassigned Unassigned
              rhn-support-tkonishi Takayuki Konishi
              Lluis Cavalle Lluis Cavalle
              Votes:
              0 Vote for this issue
              Watchers:
              4 Start watching this issue

                Created:
                Updated: