-
Enhancement
-
Resolution: Unresolved
-
 Major
Major
-
None
-
2.10 GA, 2.11.0 GA
-
3
-
False
-
False
-
Not Started
-
Not Started
-
Not Started
-
Not Started
-
Not Started
-
Not Started
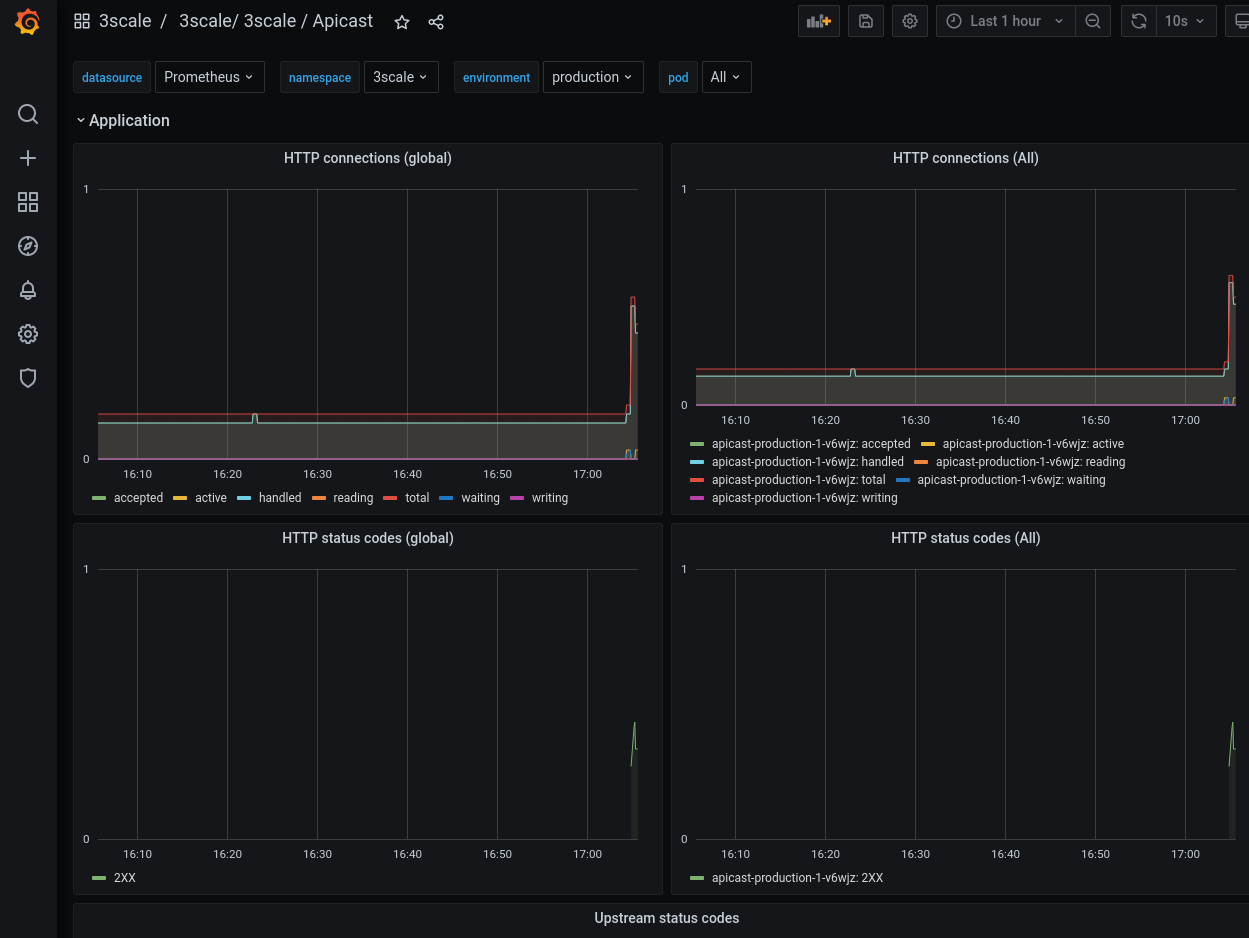
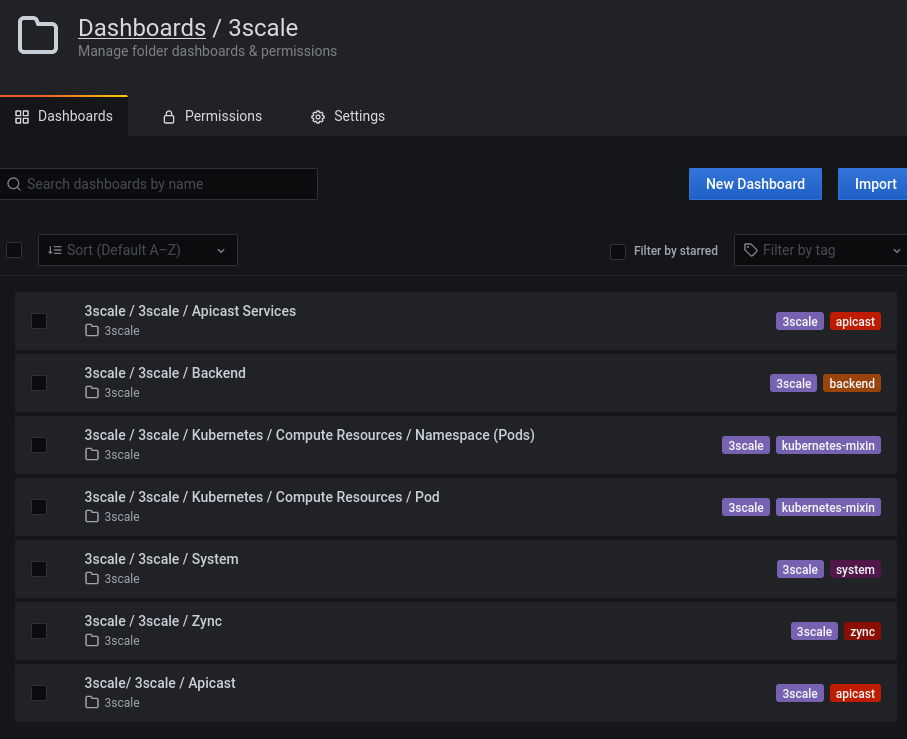
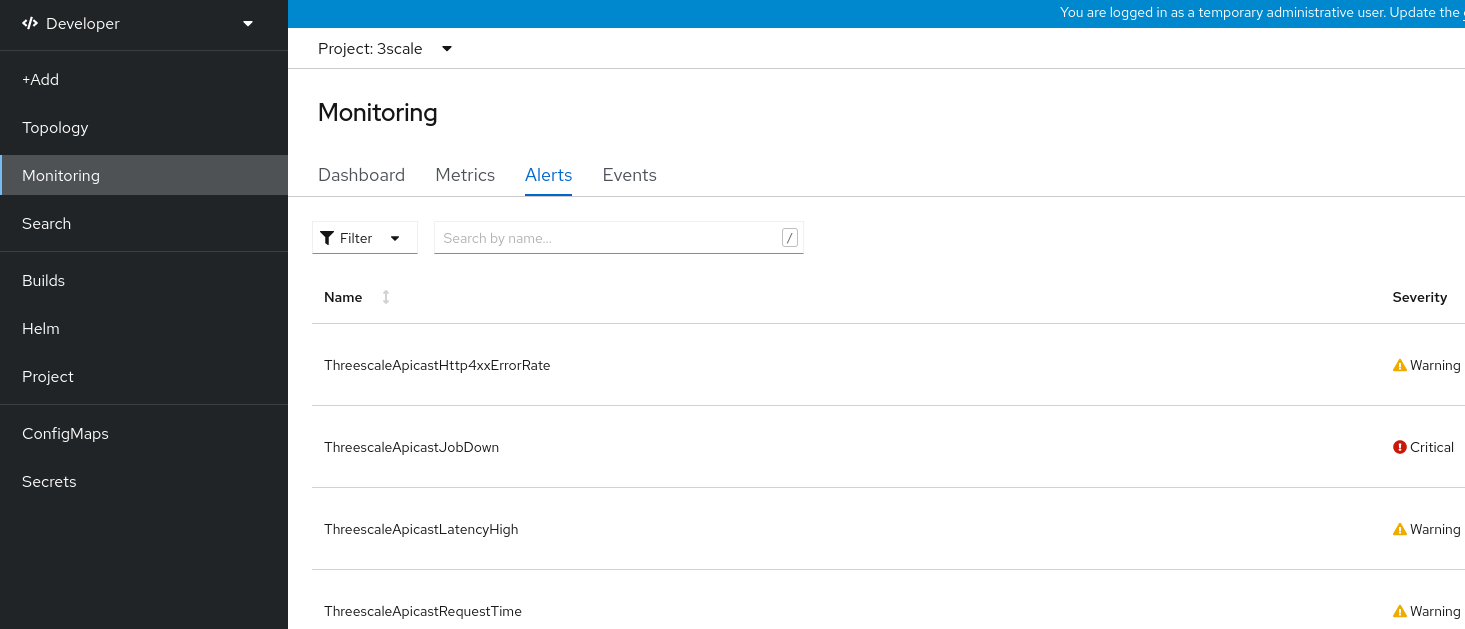
When monitoring is enabled, 3scale-operator deploys Grafana dashboards.

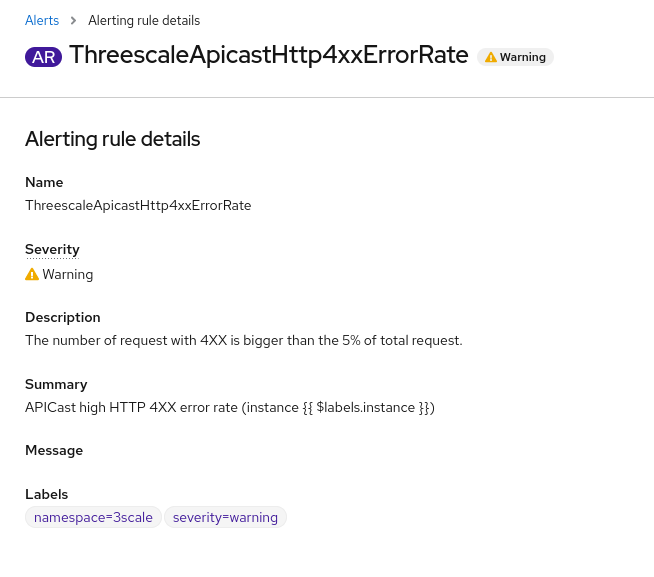
However, there's no definition for each chart. For example, what is the difference between HTTP connections (global) and HTTP connections (All) in APIcast dashboard?

Please document the description of each chart.