-
Feature Request
-
Resolution: Won't Do
-
Major
-
None
-
None
-
NEW
-
NEW
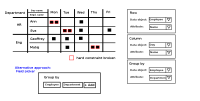
Create a generic tool for visualization of current state of a planning solution for timetabling problems (e.g. employee rostering). The displayed content should be configurable - i.e. user should have full control over what's displayed in rows/columns. There are at least 2 possible ways of performing the selection:
1. Pick data object and first-level attribute - this might be insufficient for complex objects
2. Utilize field picker (sth. we use for difficulty comparator definition) to pick an arbitrary attribute
Still, we should provide pre-configured visualization for template configurations (see PLANNER-674)
In the following implementation rounds consider:
- Adding row grouping support - i.e. group rows by selected attribute
- Highlighting cells with broken constraints
- is incorporated by
-
PLANNER-685 Workbench: Epic aggregate issue for mock designs of new features
-
- Closed
-
