-
Task
-
Resolution: Done
-
 Major
Major
-
None
-
None
-
None
-
Product / Portfolio Work
-
False
-
-
False
-
0
-
None
-
None
-
Sprint 278
Background
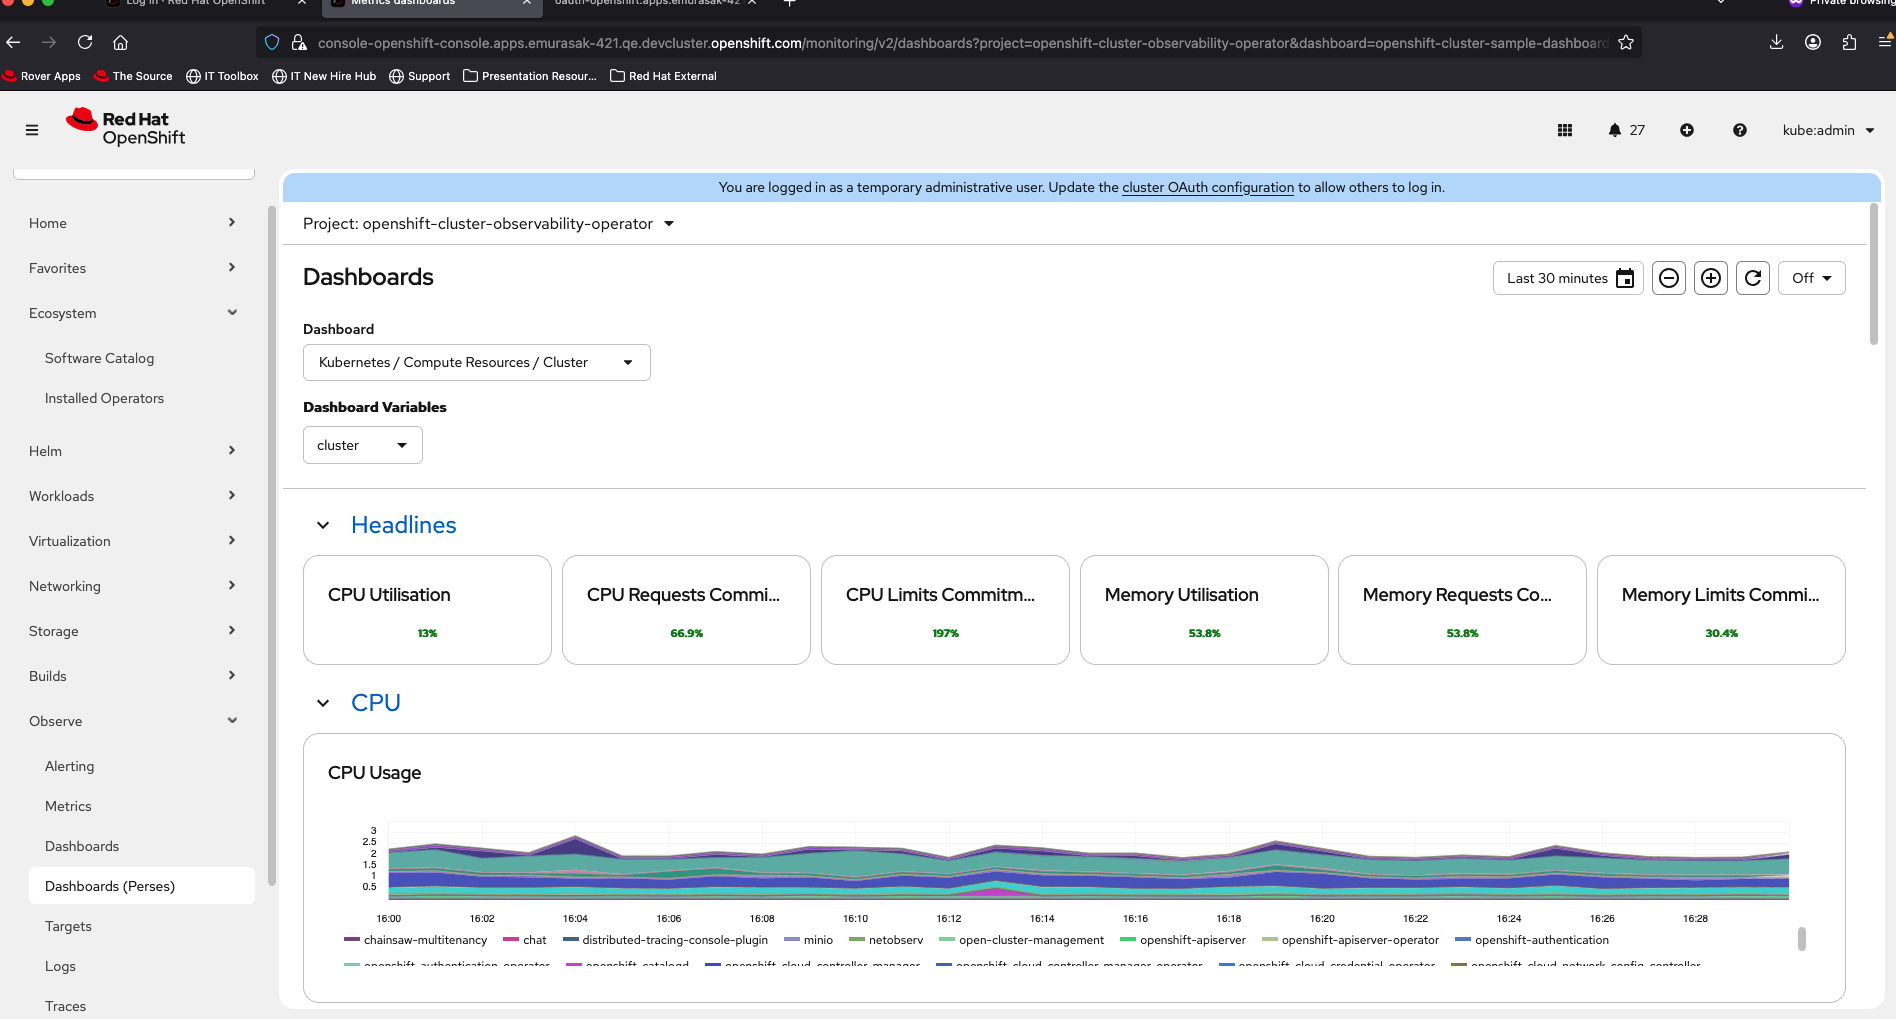
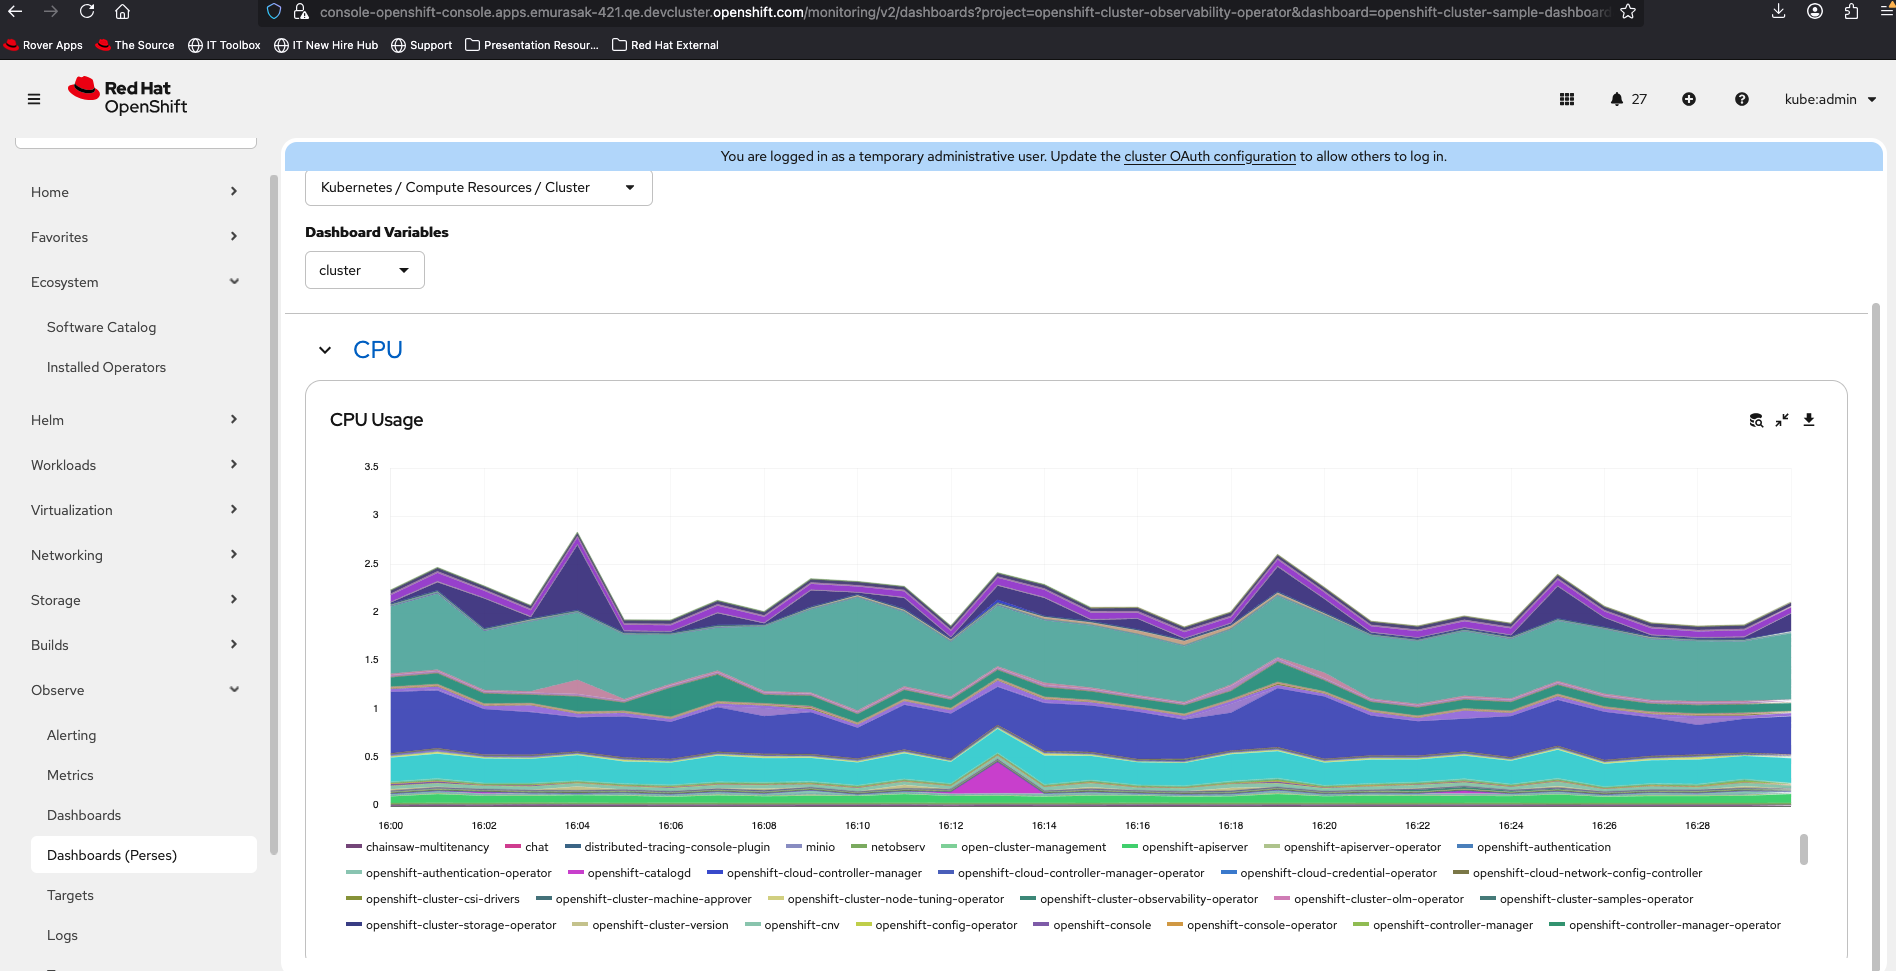
In OpenShift > monitoring-plugin > Dashboards (Perses), we'll need to test that the 'Export as CSV' feature works for the panel types TimeSeriesChart, BarChart, and Table.
The following development tickets need to be completed before testing can begin:
https://issues.redhat.com/browse/OU-839
https://issues.redhat.com/browse/OU-840
https://issues.redhat.com/browse/OU-841
https://issues.redhat.com/browse/OU-845
Outcomes
- OpenShift > monitoring-plugin > Dashboard (Perses) > Panel types TimeSeriesChart, BarChart, and Table: should have a button/link to export chart data into a .csv file.
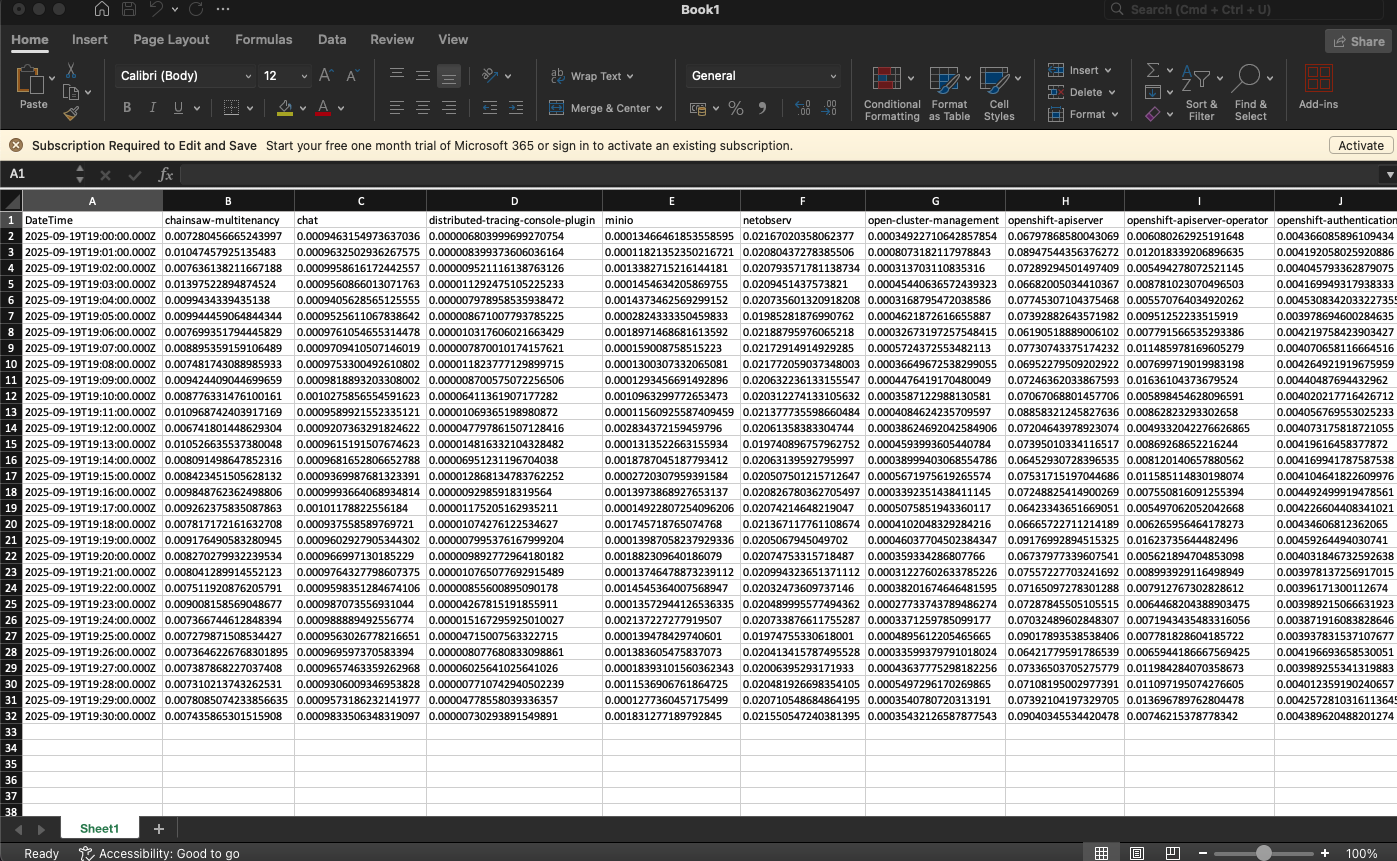
- .csv file data should match what is displayed in the panel
- Exact placement of Export as CSV in OpenShift is TBD