-
Bug
-
Resolution: Done
-
 Major
Major
-
None
-
OpenShift 4.17, OpenShift 4.18, openshift-4.19
-
None
-
Quality / Stability / Reliability
-
False
-
-
1
-
Important
-
None
-
Sprint 278, Sprint 279
-
None
-
None
-
None
ISSUE 1
Developers when using the "Administrator" view are not able to view the details for the metrics.
For reproducing it, log in as a normal user in the OpenShift Console and select Administrator view, go to Workloads > Pods > <Pod name> > Metrics trab and observe the metrics:
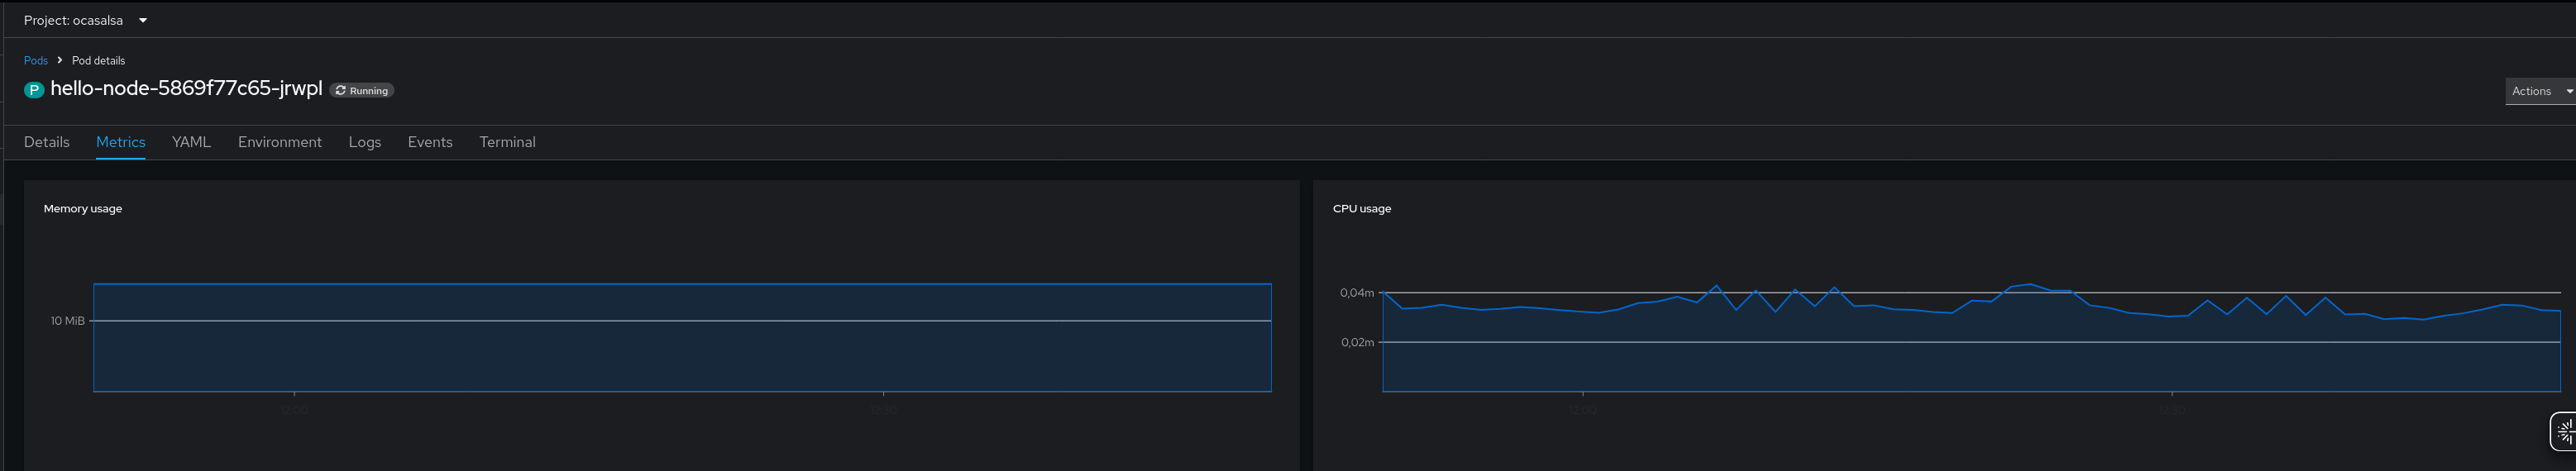
Now, click on any of the metrics, for instance "Memory usage" to inspect the details, and nothing is presented on the screen:
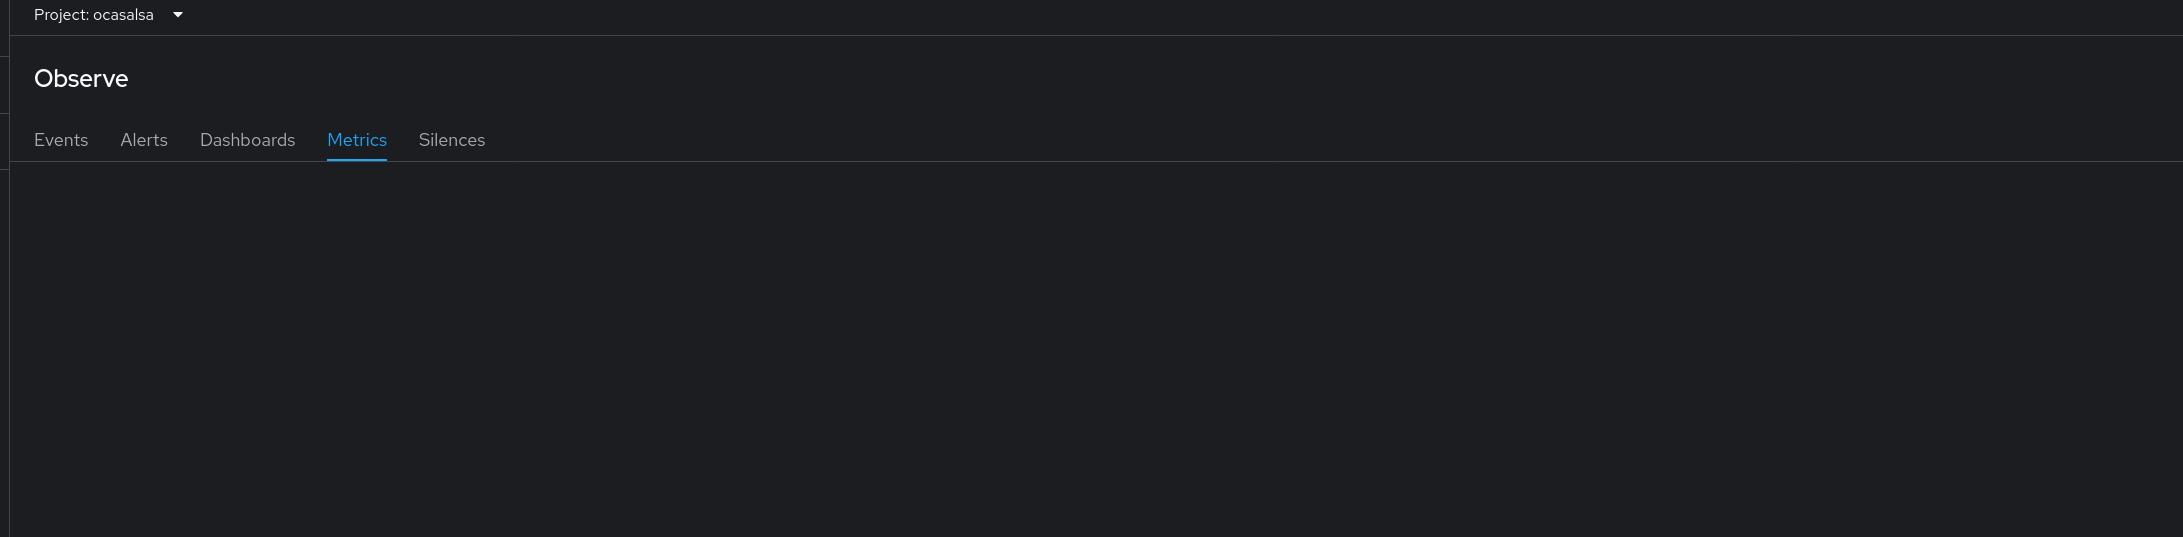
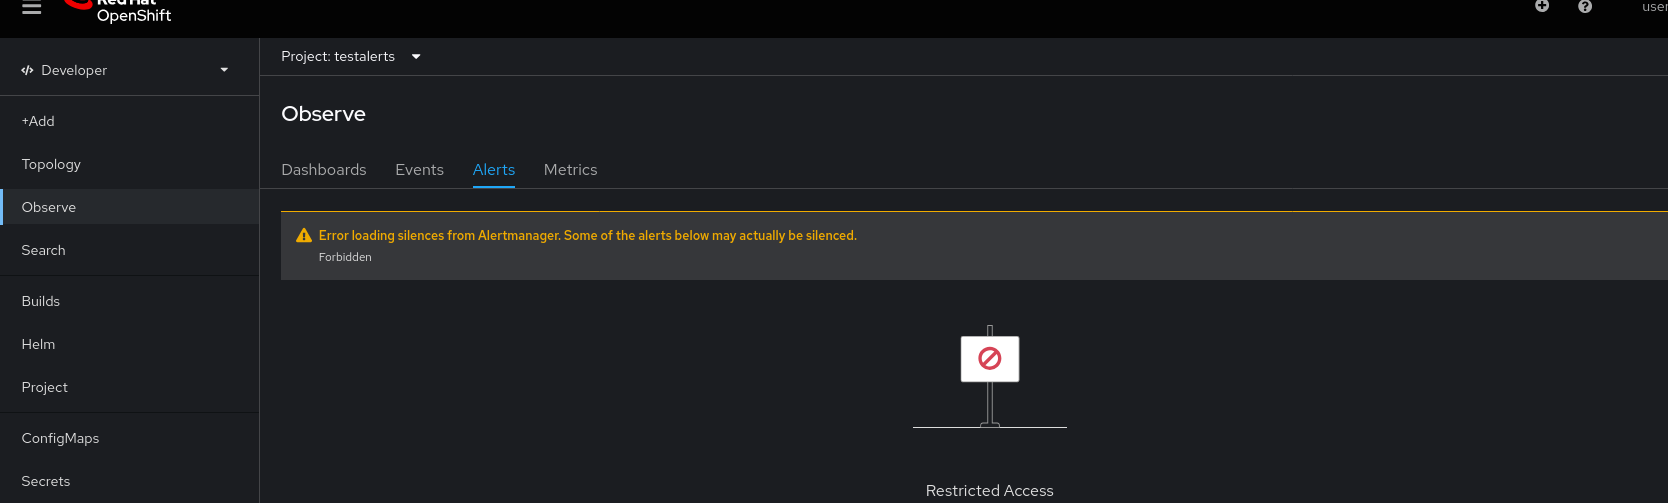
Needed to mention that when inspecting in a browser, it's observed "403 Forbidden" accessing also to:
https://console-openshift-console.apps.example.com/api/prometheus/api/v1/rules
https://console-openshift-console.apps.example.com/api/alertmanager/api/v2/silences
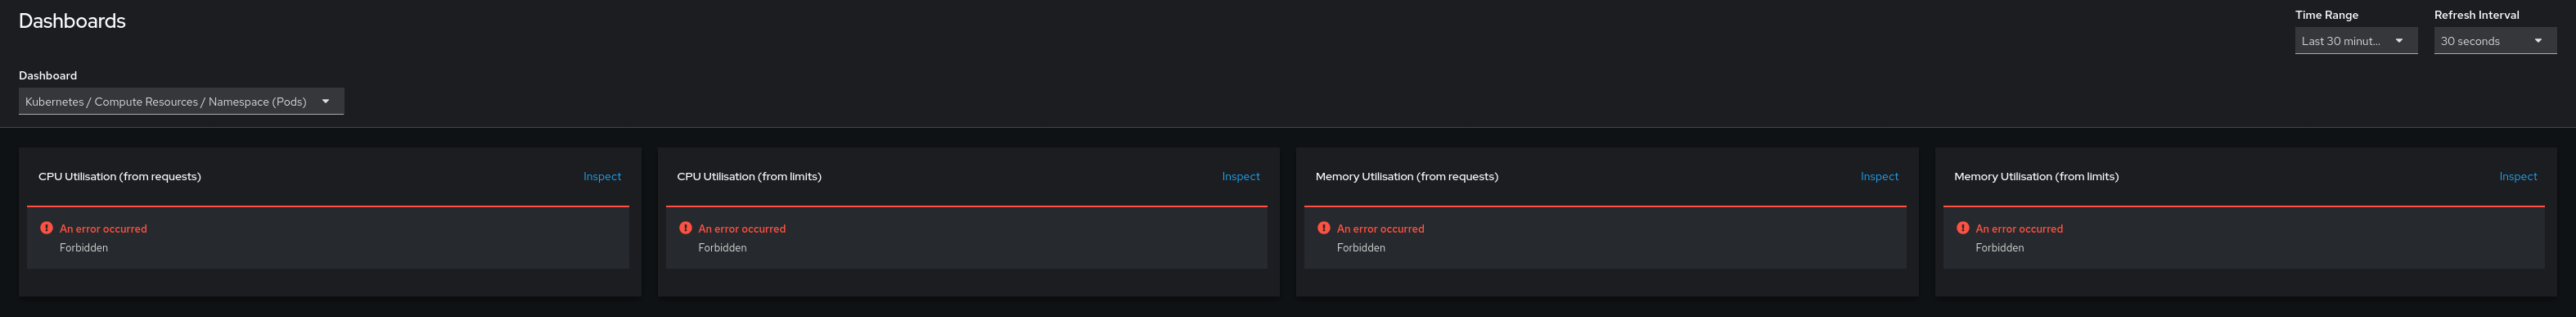
Also, when accessing to the OpenShift Console and select Administrator view, go to Workloads > Pods > <Pod name> > Metrics trab. The result is empty, but it's observed the "Dashboards" section that when clicked and fails and redirect to the Dahsboard: "kubernetes / Compute Resources / Namespace (Pods) receiving a "Forbidden error":


- is cloned by
-
-
- Verified
-
- is related to
-
-
- Closed
-
-
-

- Closed
-
- links to
