-
Epic
-
Resolution: Done
-
 Critical
-
None
-
None
-
Pipeline Dahbaord and Results UX enhancements
-
False
-
-
False
-
Yellow
-
To Do
-
SECFLOWOTL-67 - Tekton Results GA
-
0
-
0% To Do, 0% In Progress, 100% Done
-
Not Supported
Accepted criteria:
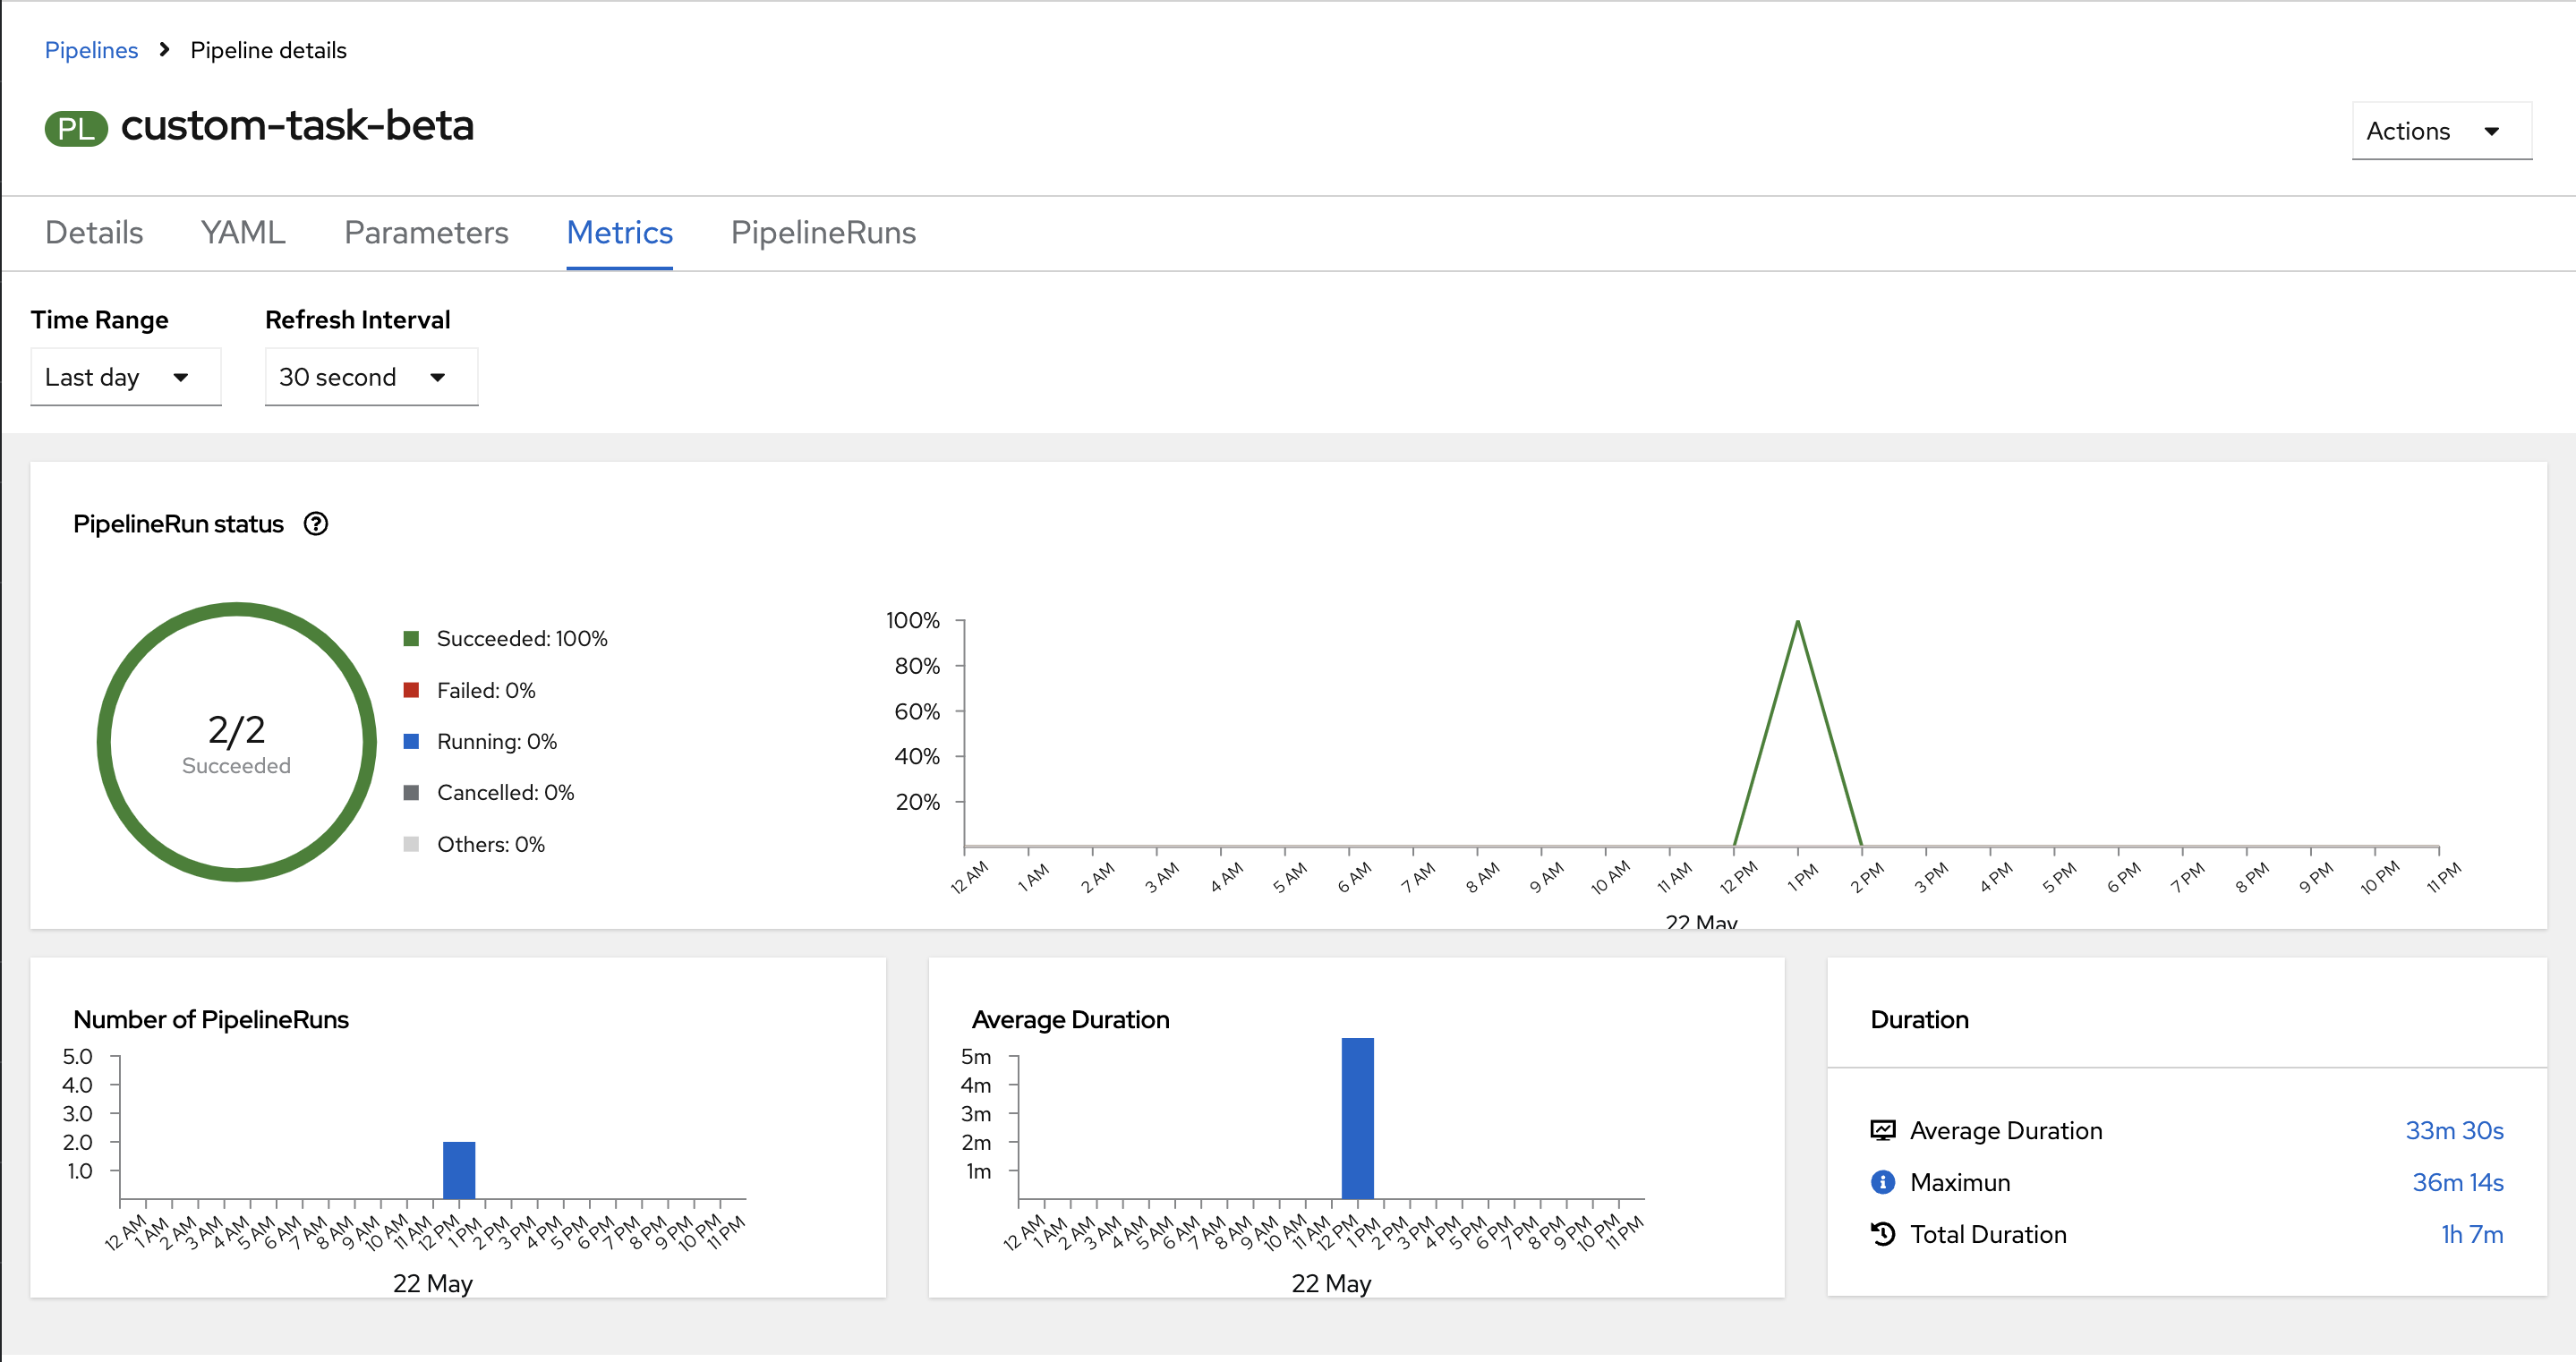
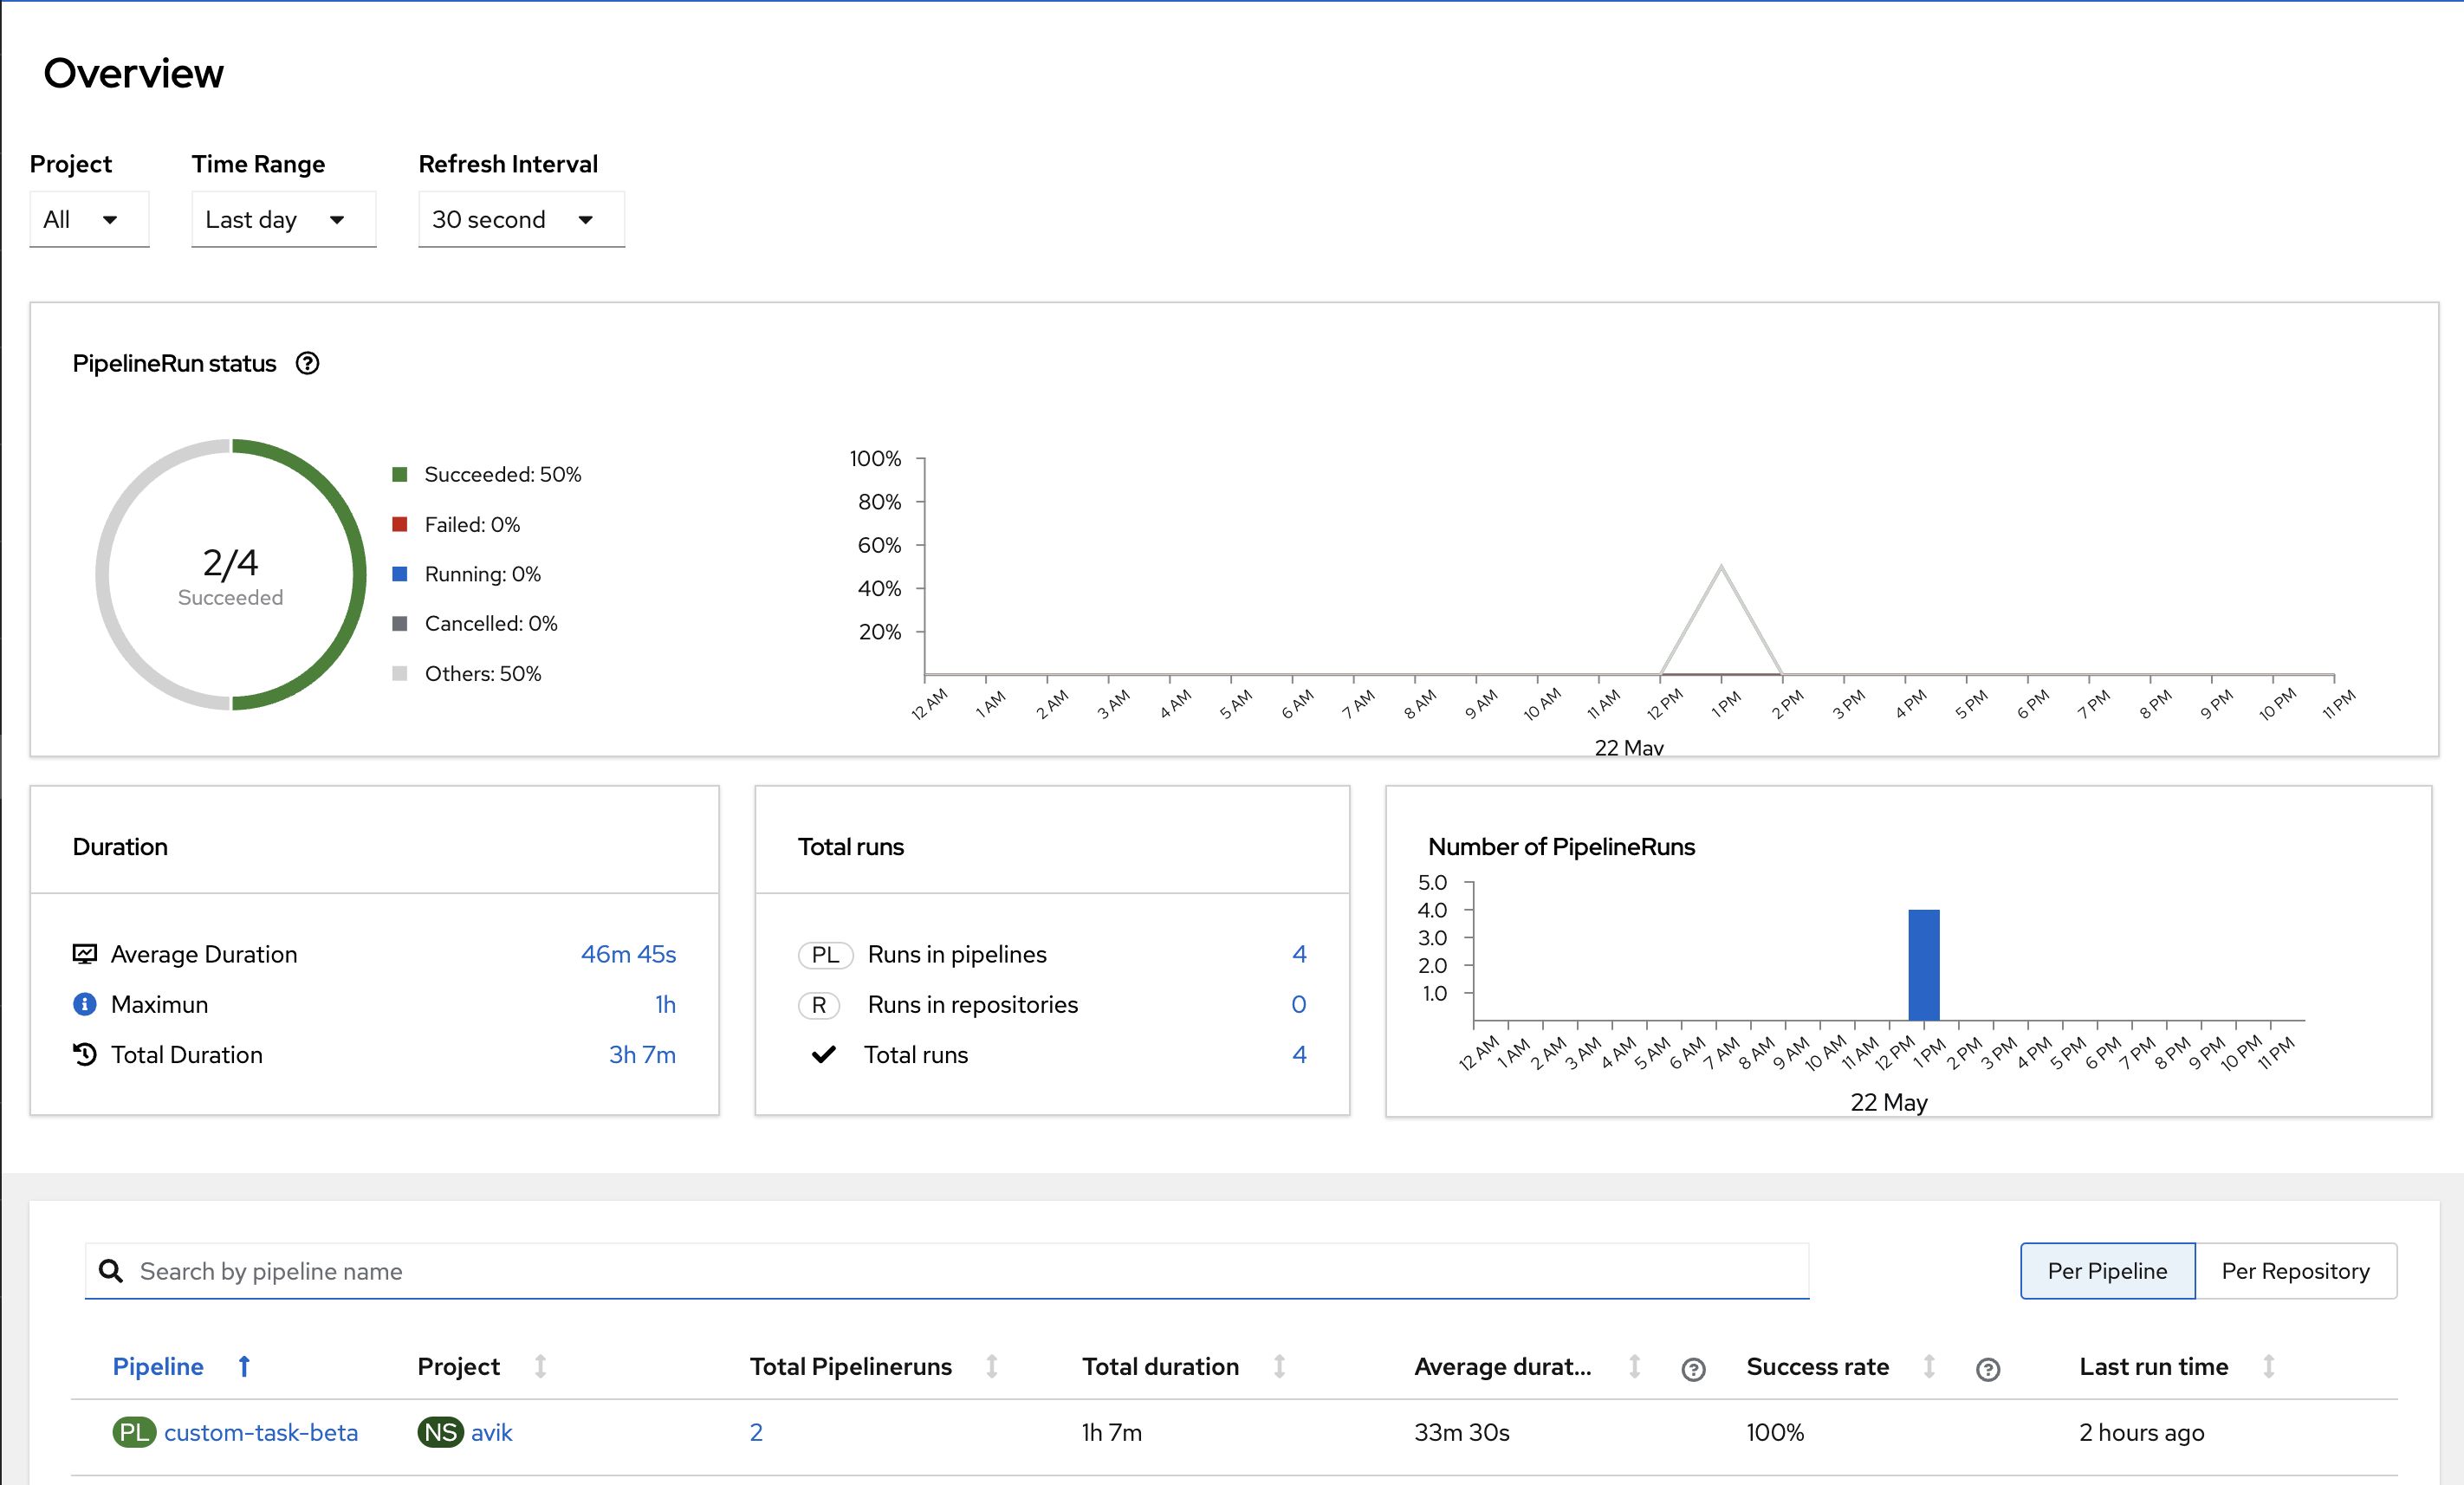
The Overview Dashboard only appears when results are enabled. All the statistics come from the results API today.
But the dashboard should always be available regardless if TektonResults is installed and enabled or not.
- When results are disabled, we should show the stats for objects in the cluster (See if Prometheus can help here )
- When results are enabled, the stats should be shown from the TektonResults Summary API
- A selector to switch between Kubernetes API and TektonResults summary API should be on the dashboard and metrics tab as well (similar to
ODC-7562) - Whenever the user clicks from the dashboard or metrics tab to navigate to a list, we should pass the right filter to show the same data.
- The new metrics will be displayed then always, and the static metrics tab will not be shown anymore.
Unknowns we can address as spikes:
- Can we show some of the data in the (new) dashboard from the Prometheus endpoint?
- If we need a backend, will the pipelines operator provide such an API or should we do one as part of the dynamic plugin?
- clones
-
-
- Closed
-
