-
Bug
-
Resolution: Done
-
 Critical
-
4.10
-
Quality / Stability / Reliability
-
False
-
-
None
-
None
-
None
-
None
-
None
-
Rejected
-
MON Sprint 227, MON Sprint 228, MON Sprint 229
-
3
-
Customer Escalated
-
-
-
None
-
None
-
None
-
None
-
None
-
None
-
None
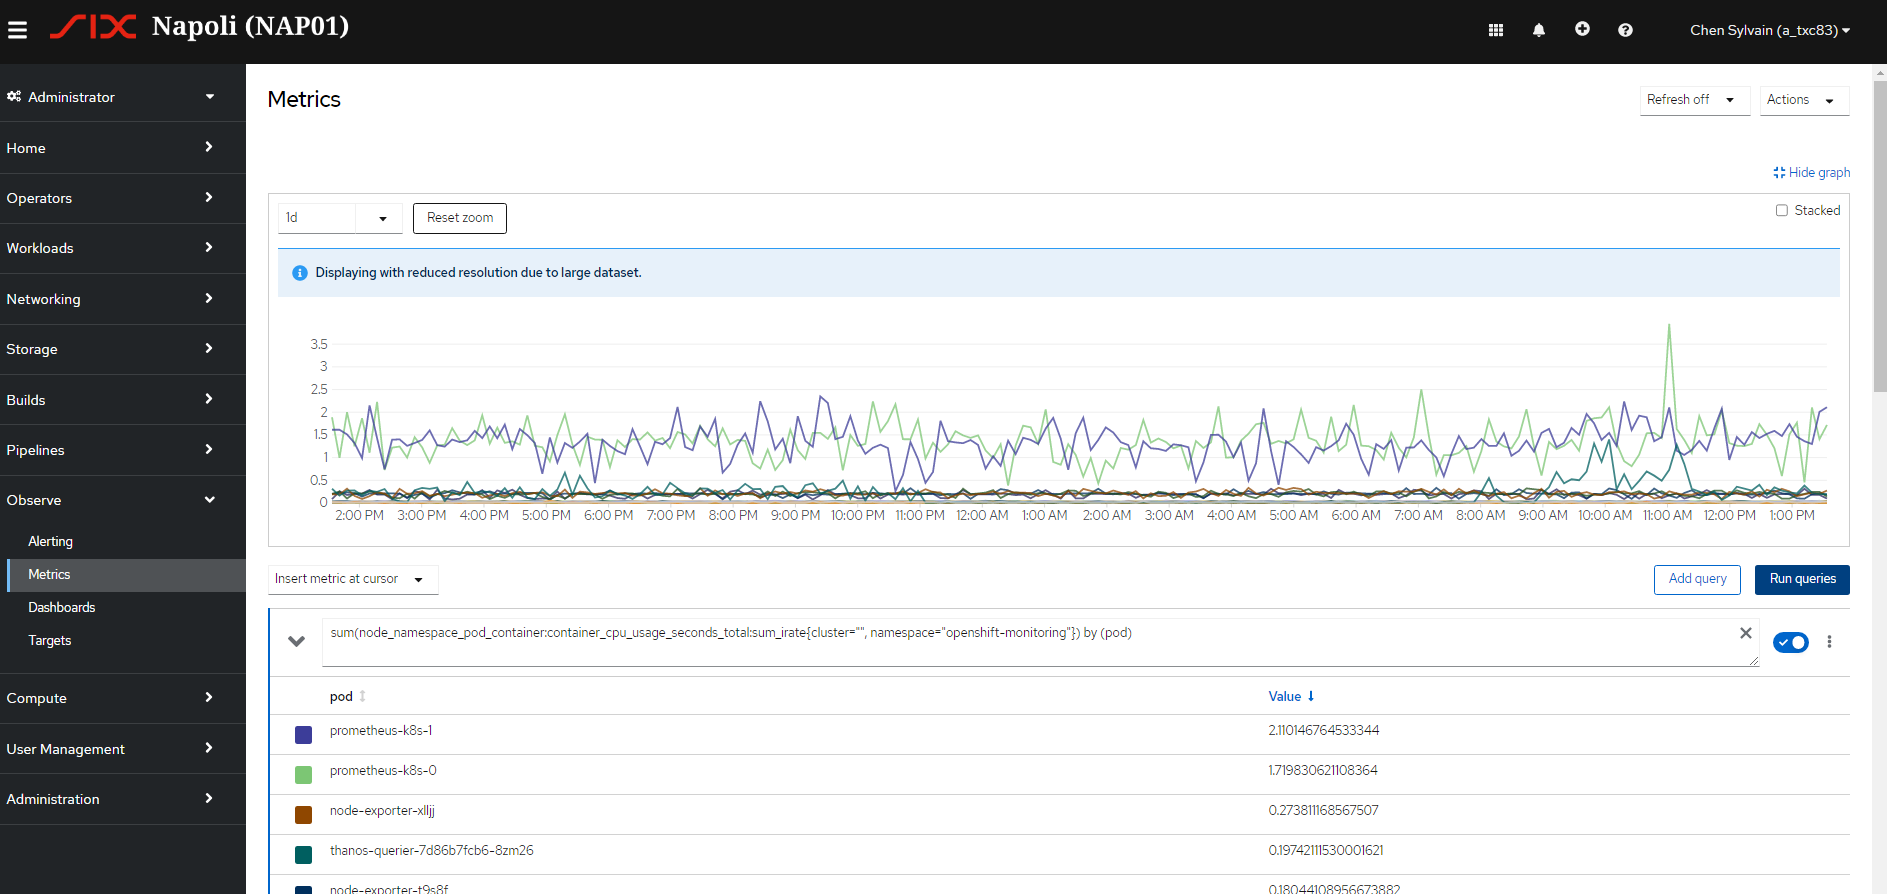
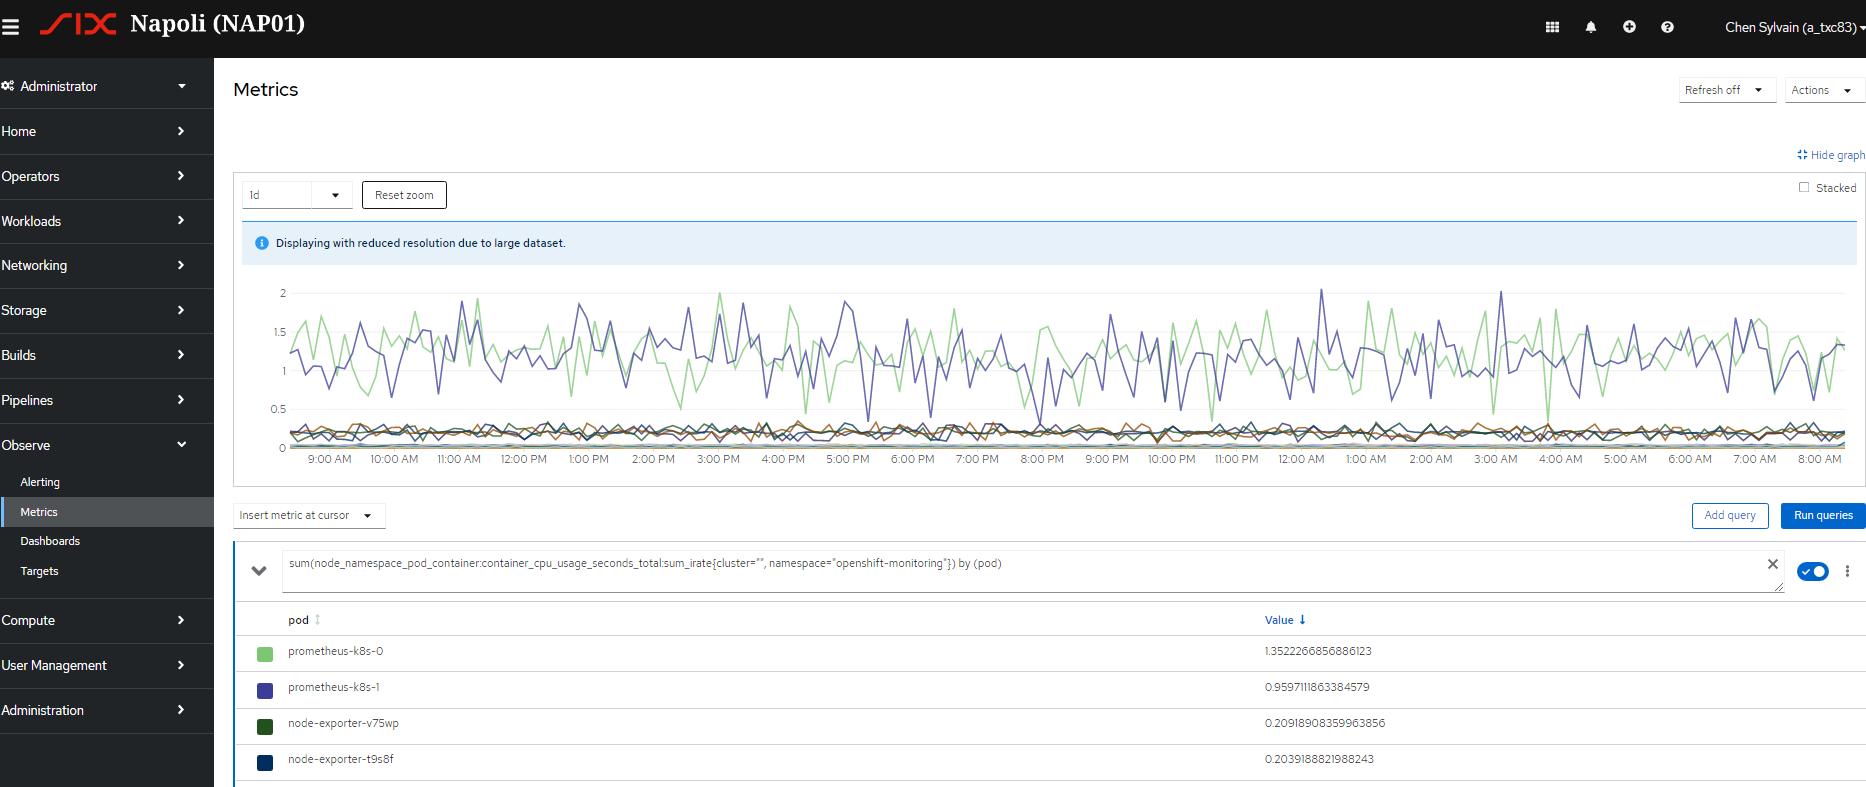
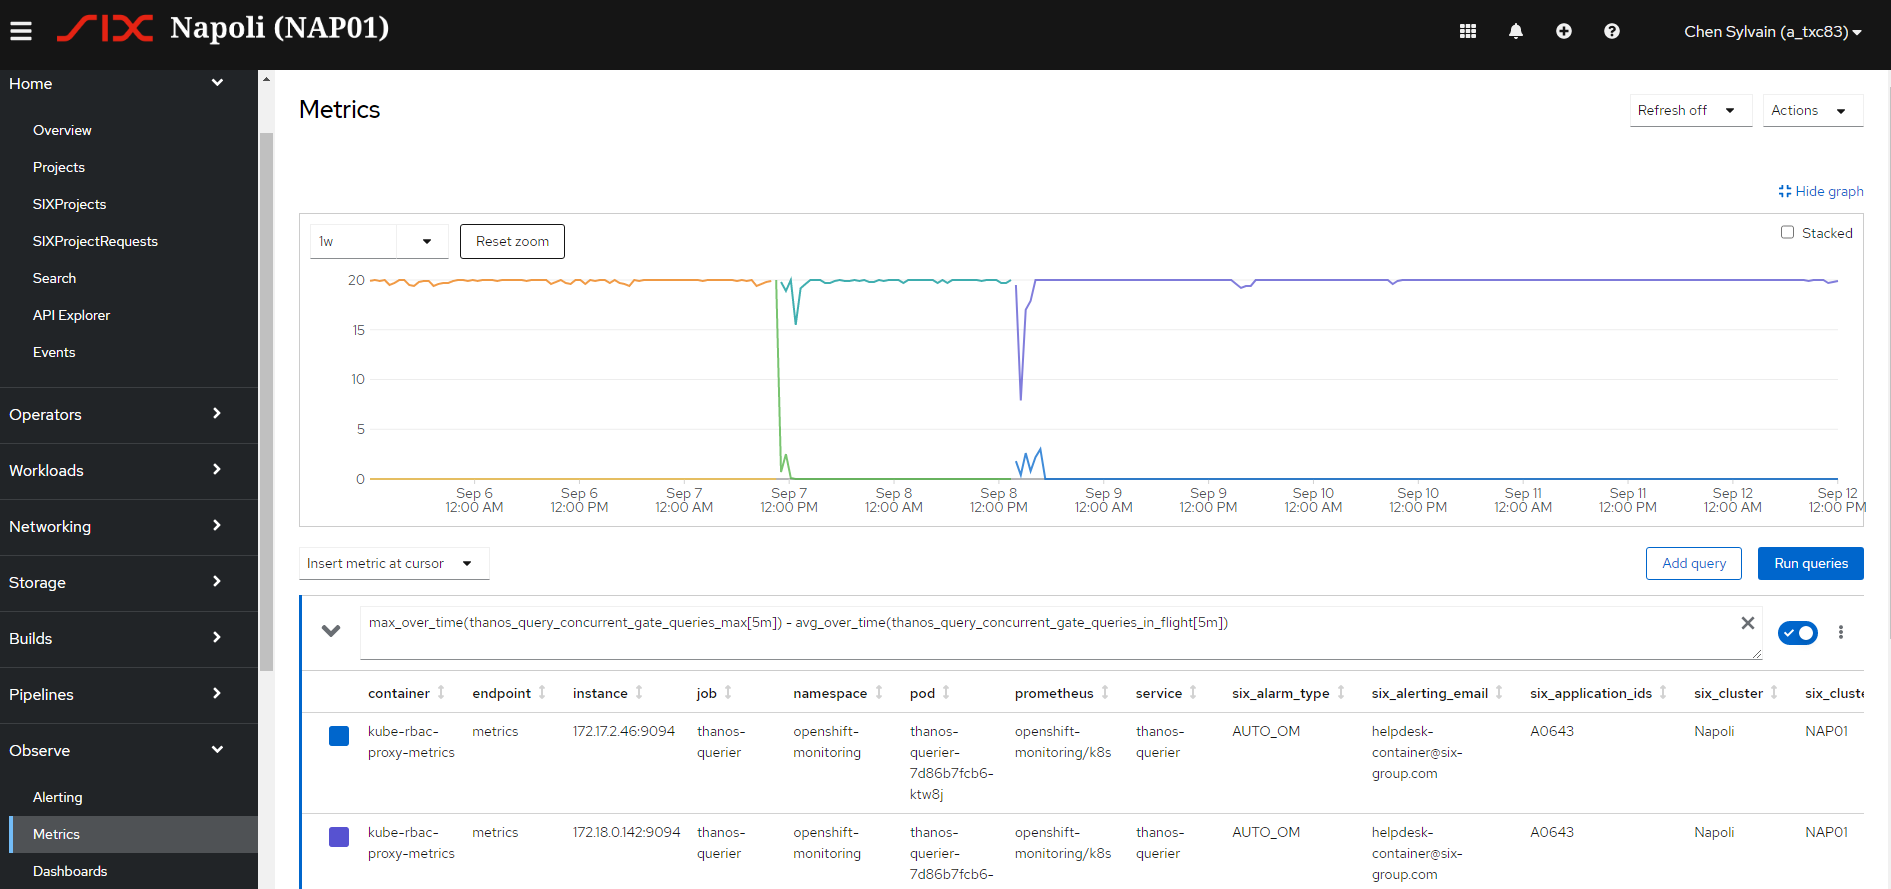
Hello,
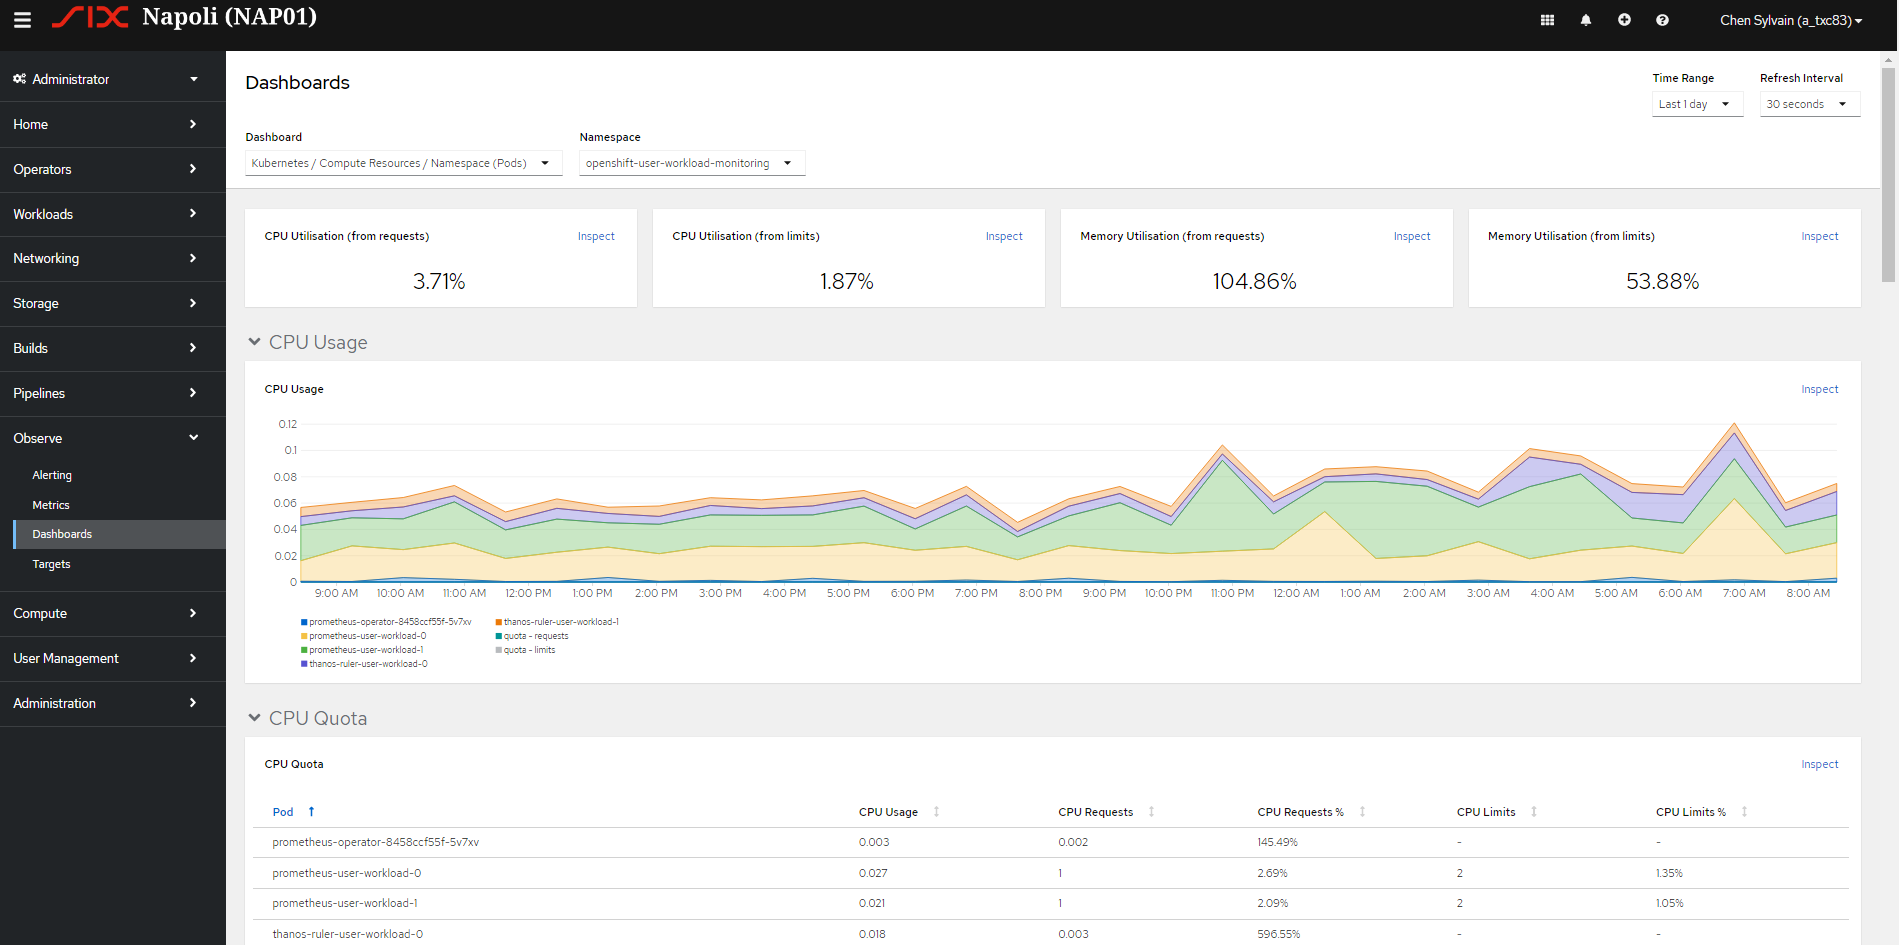
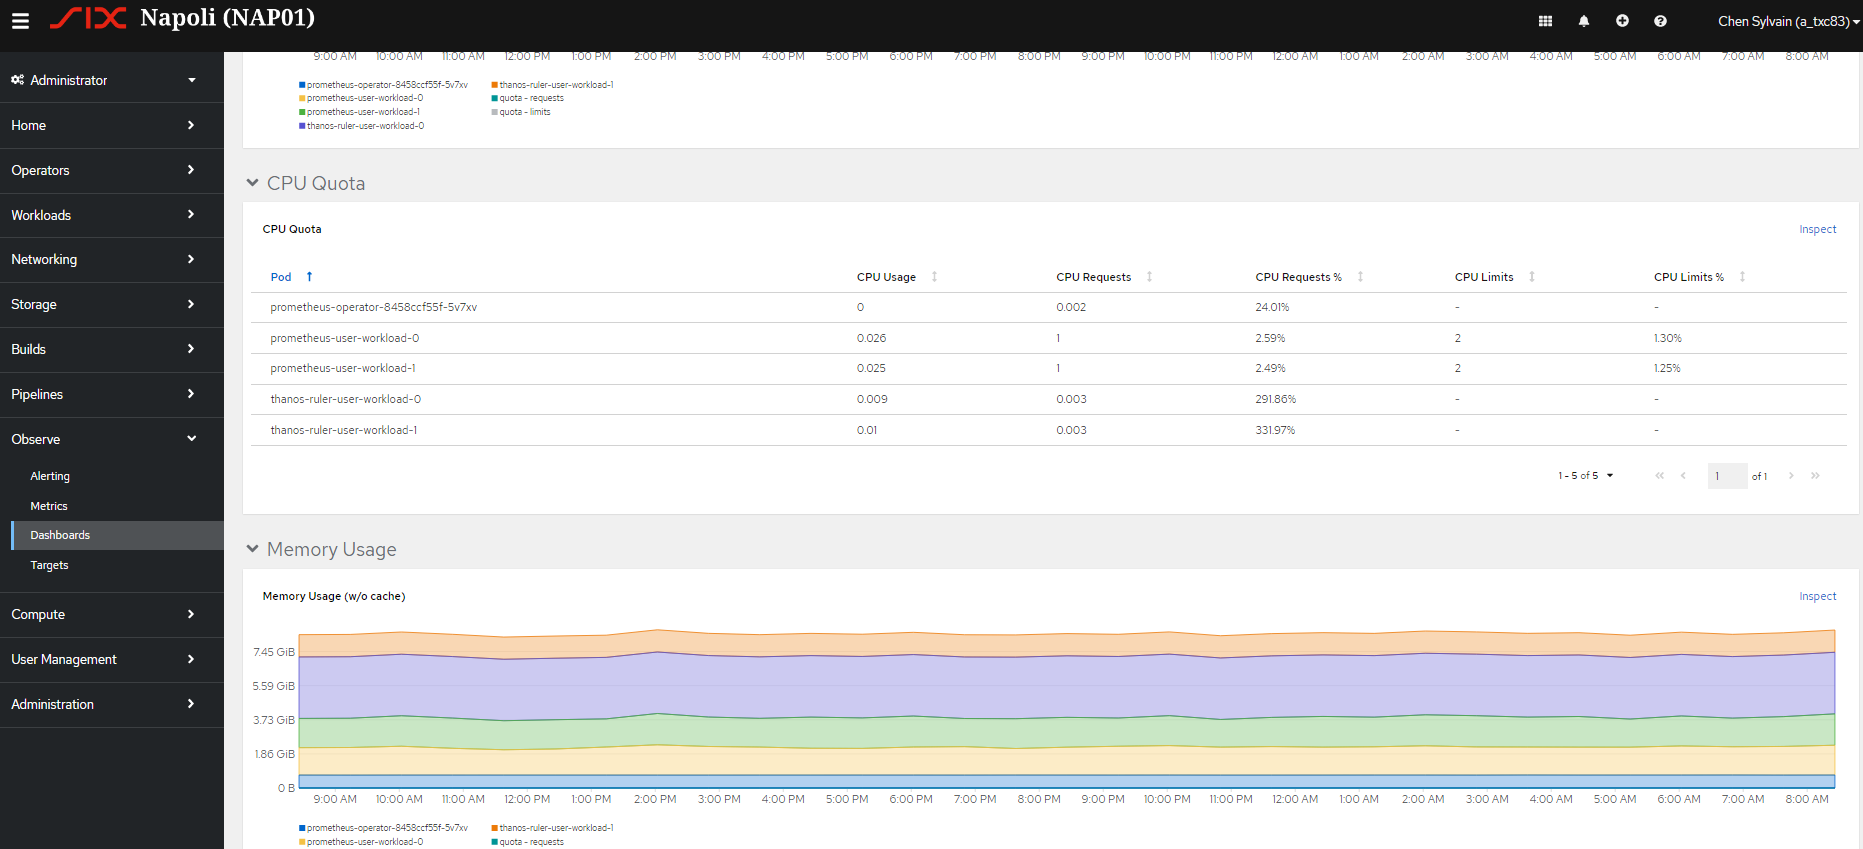
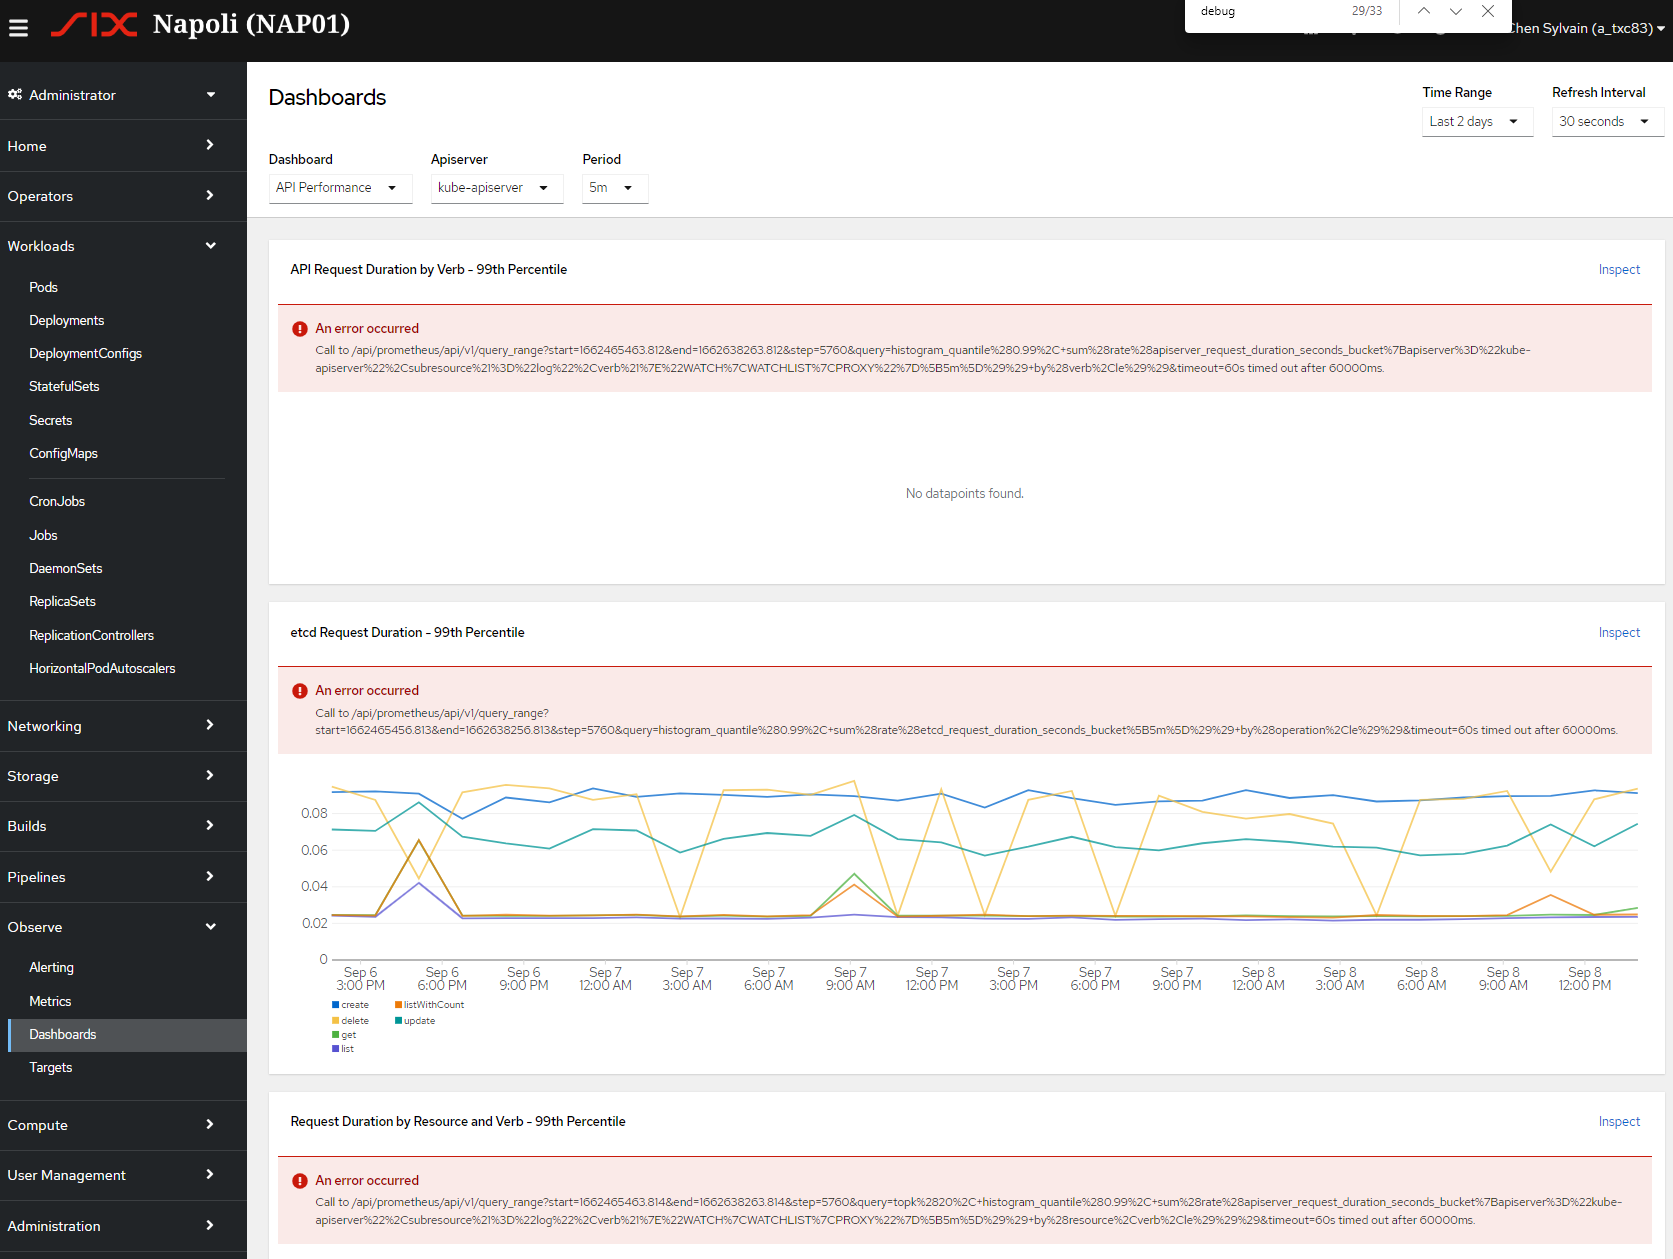
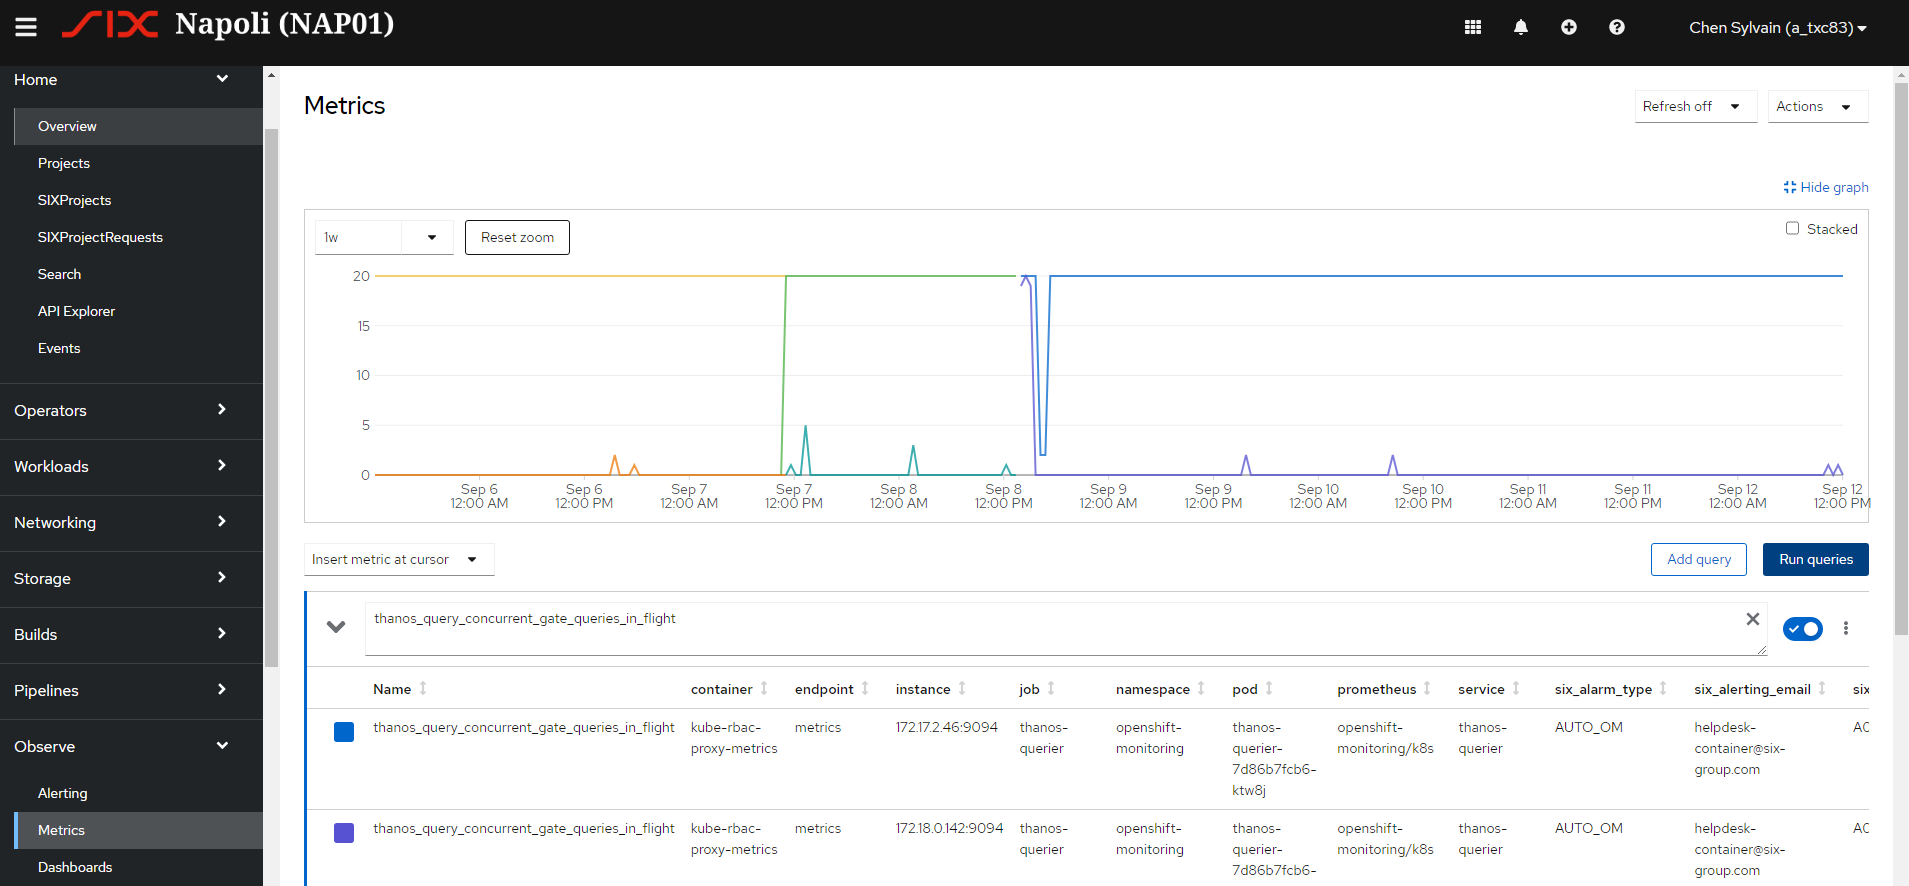
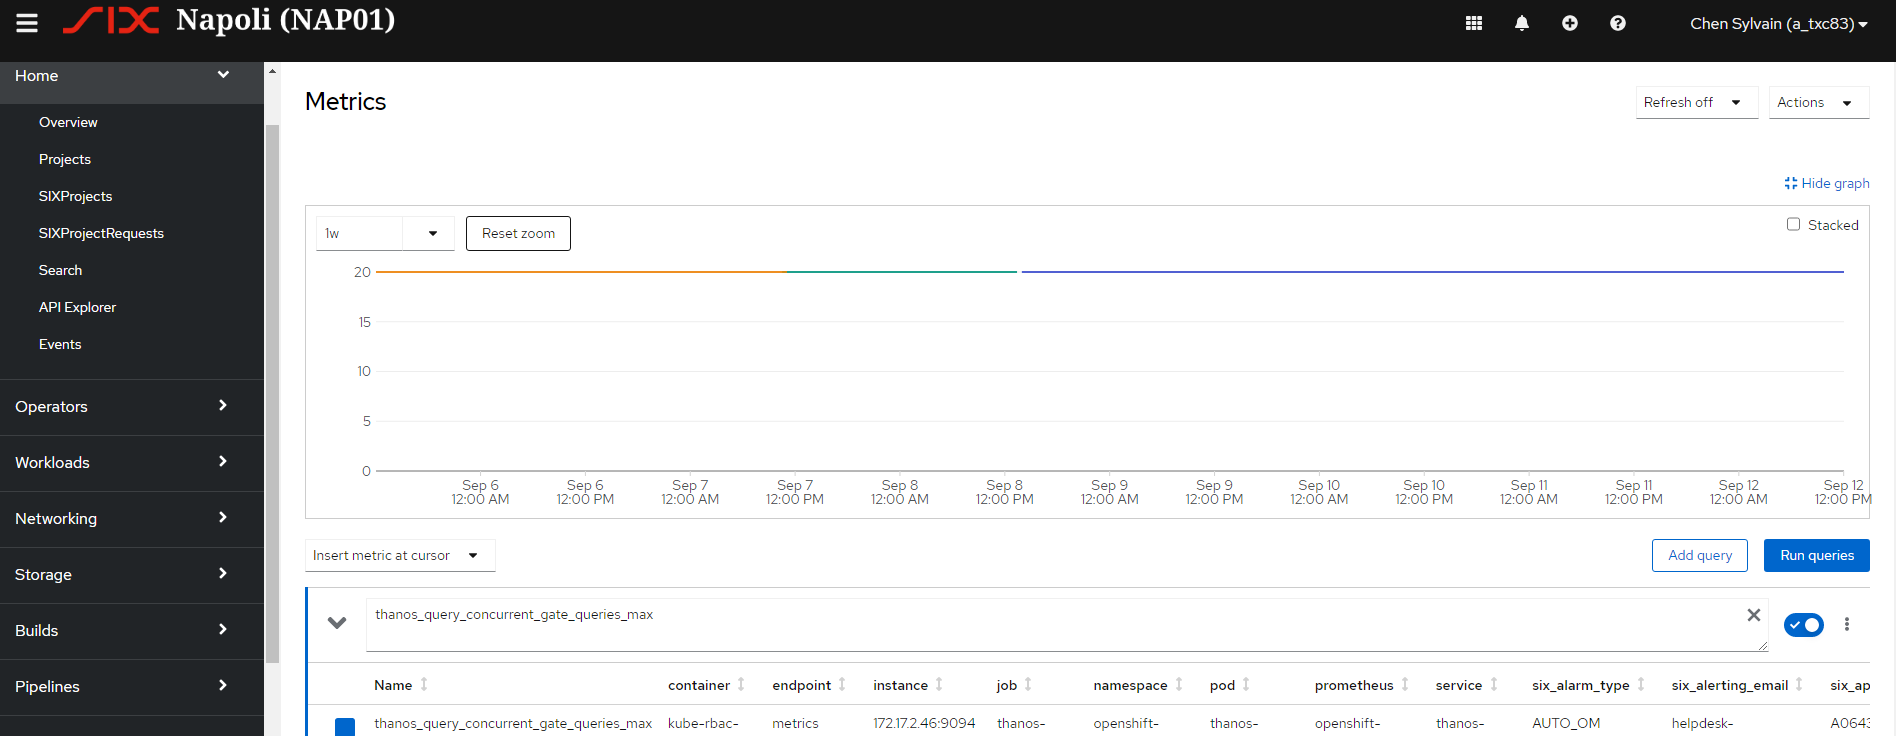
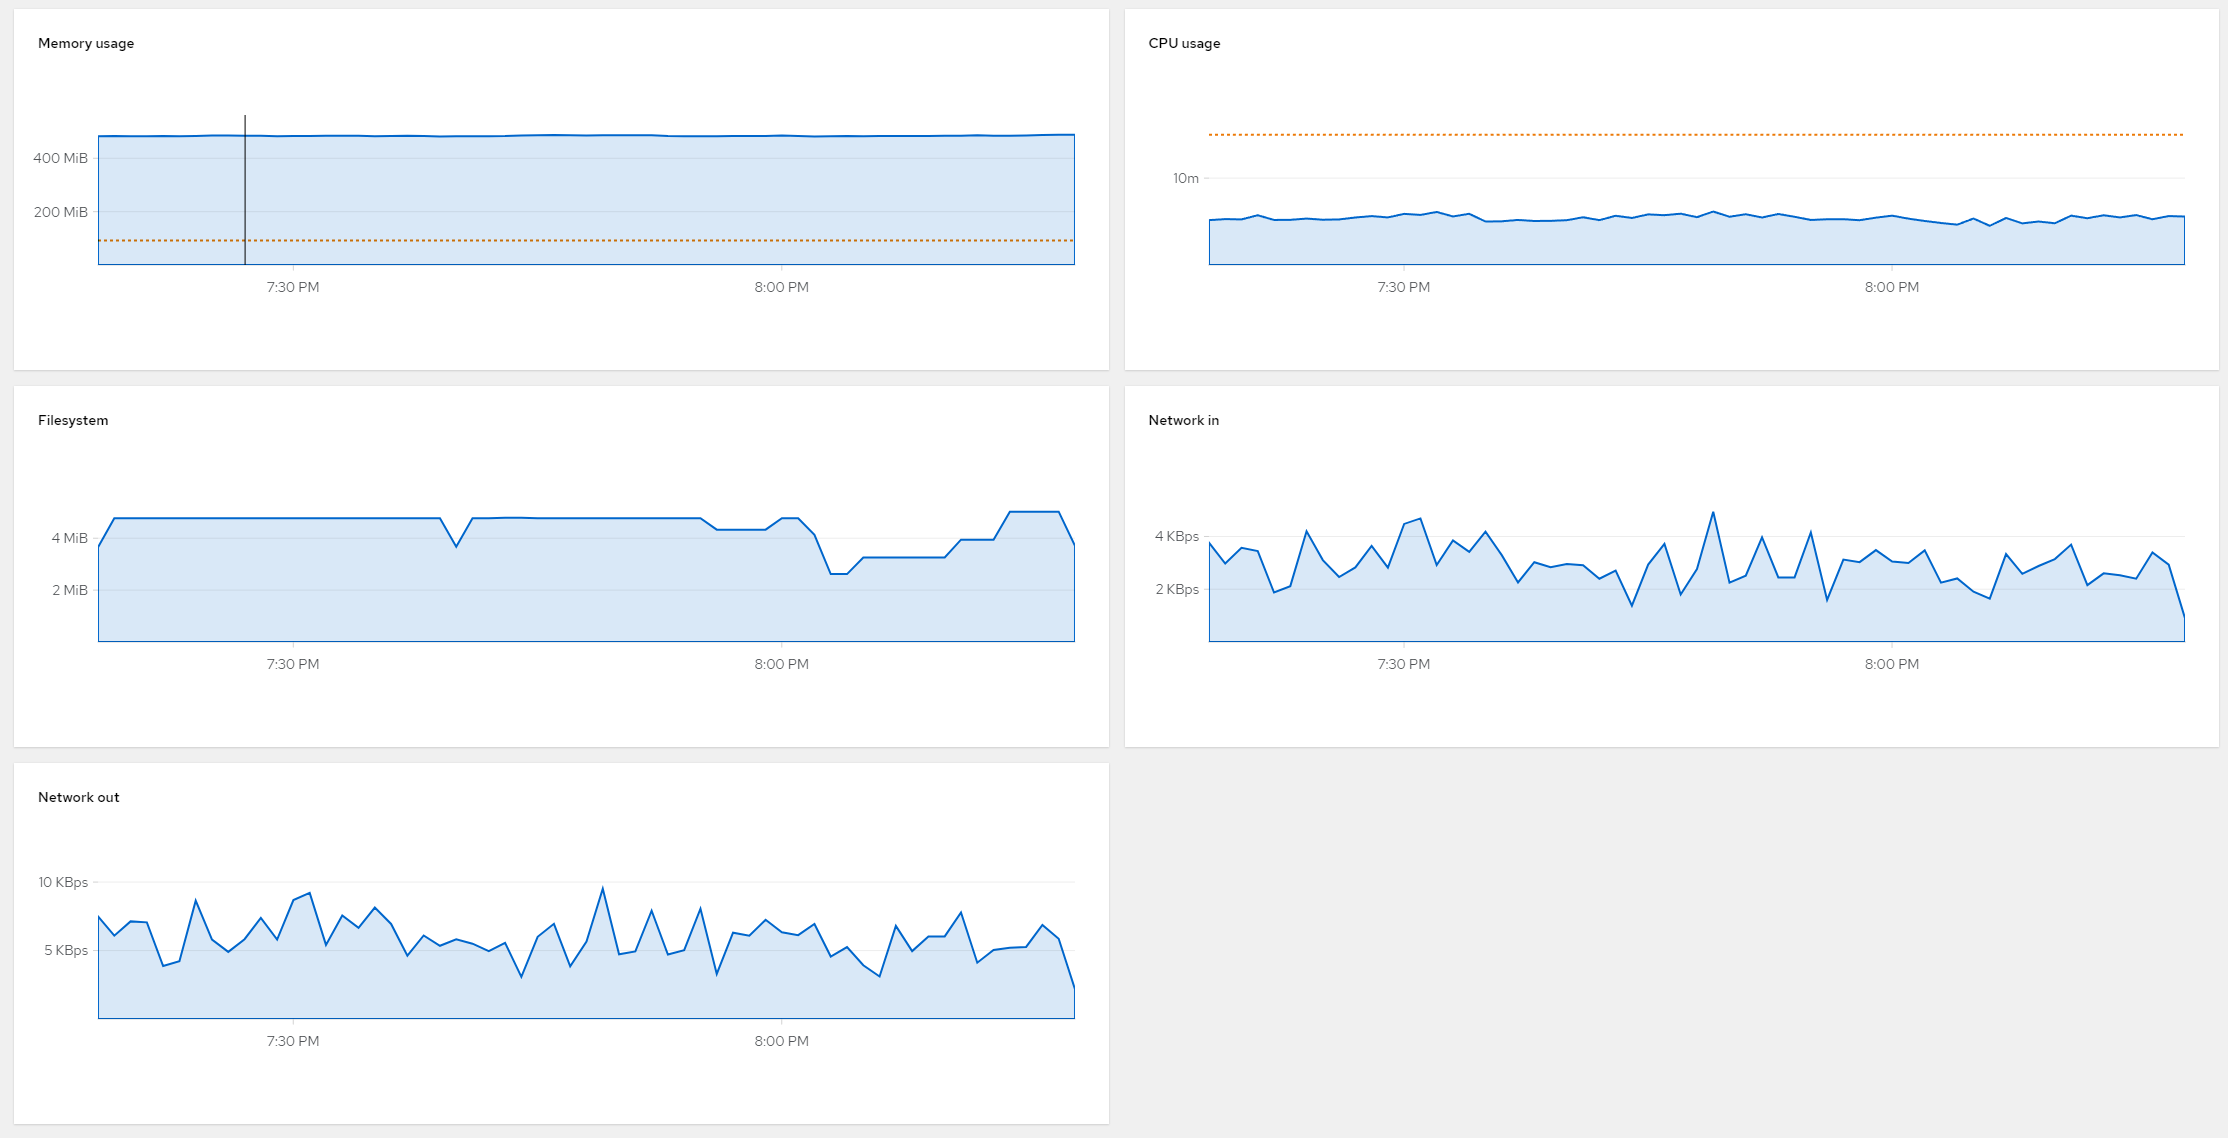
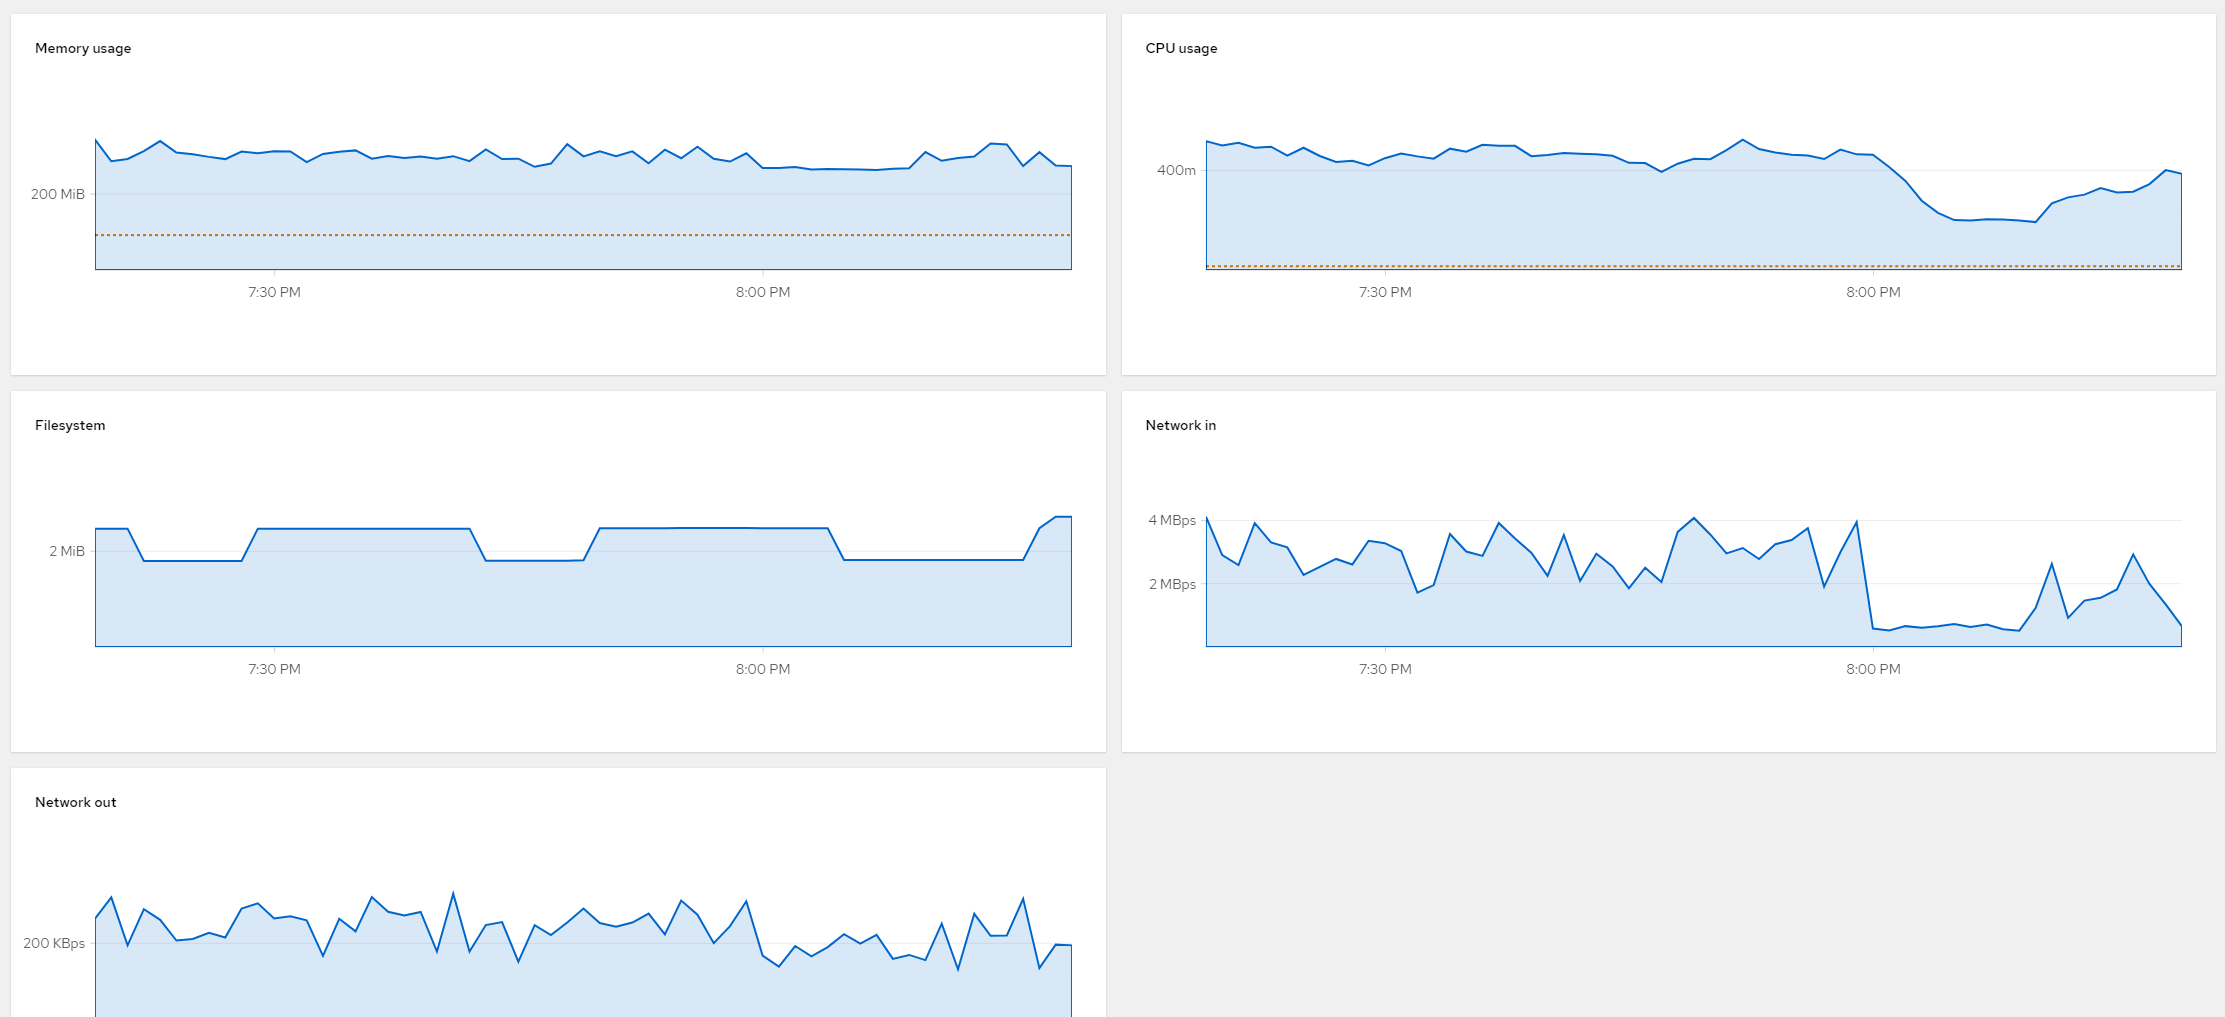
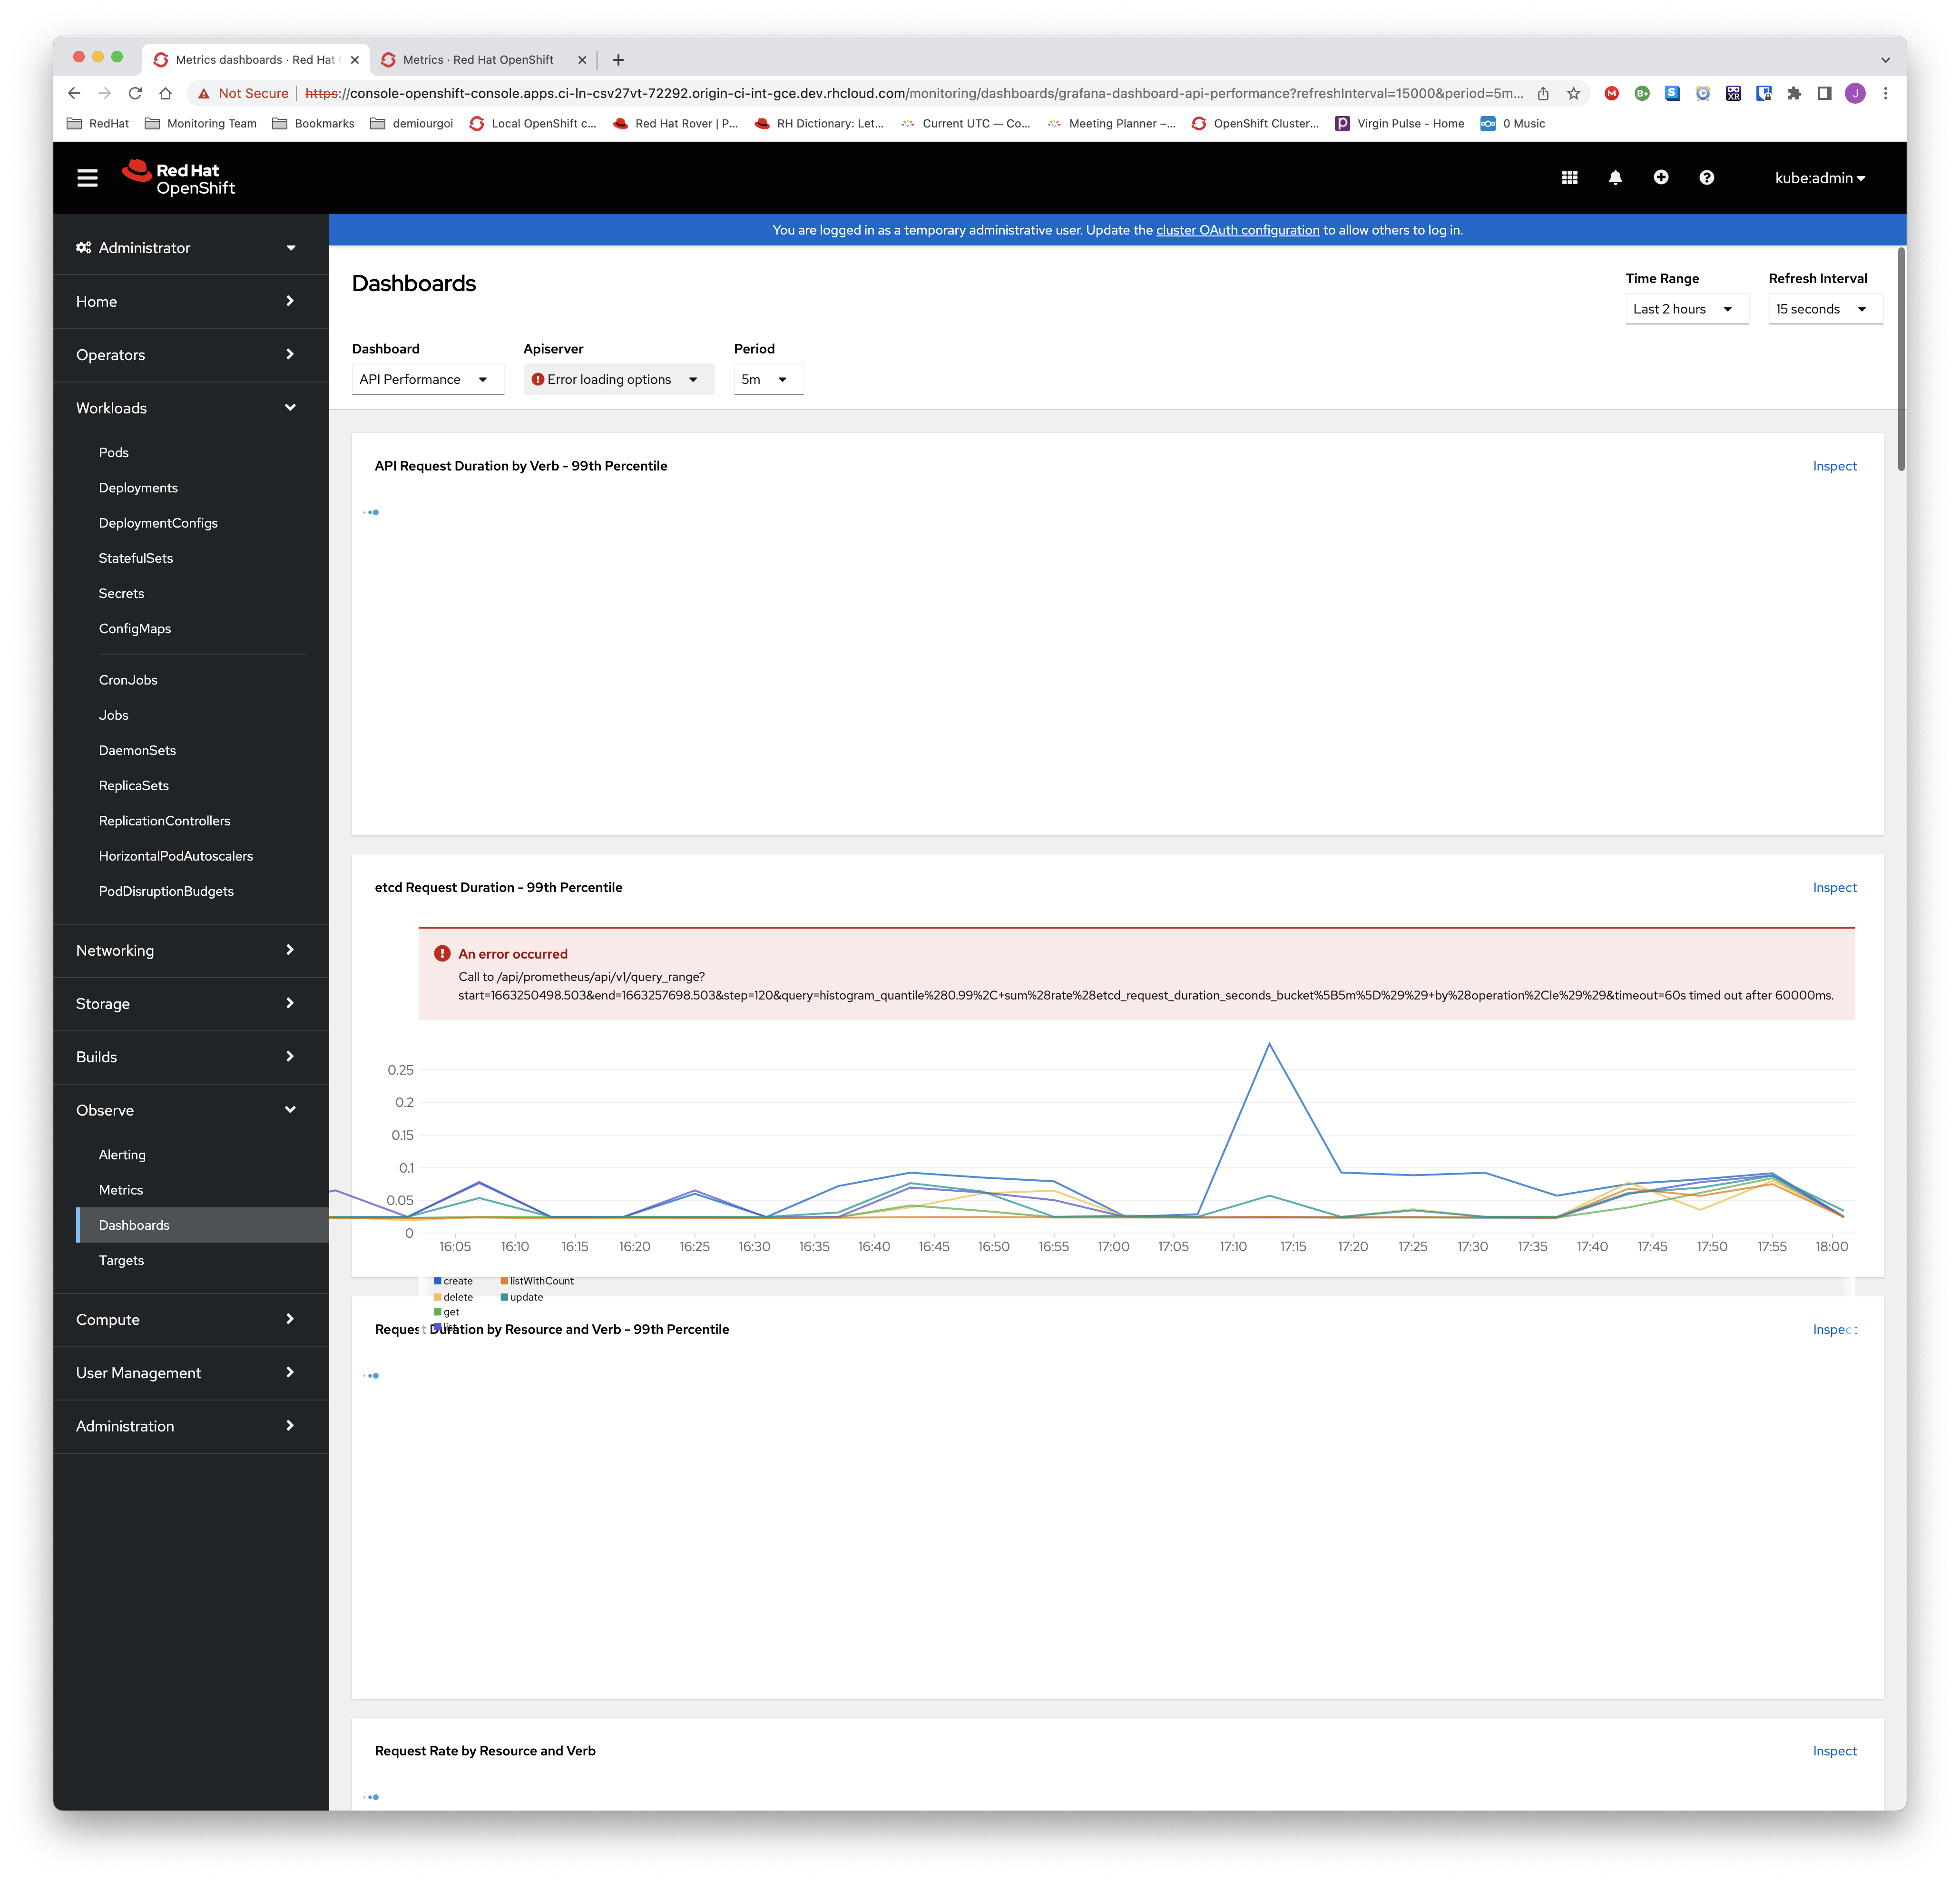
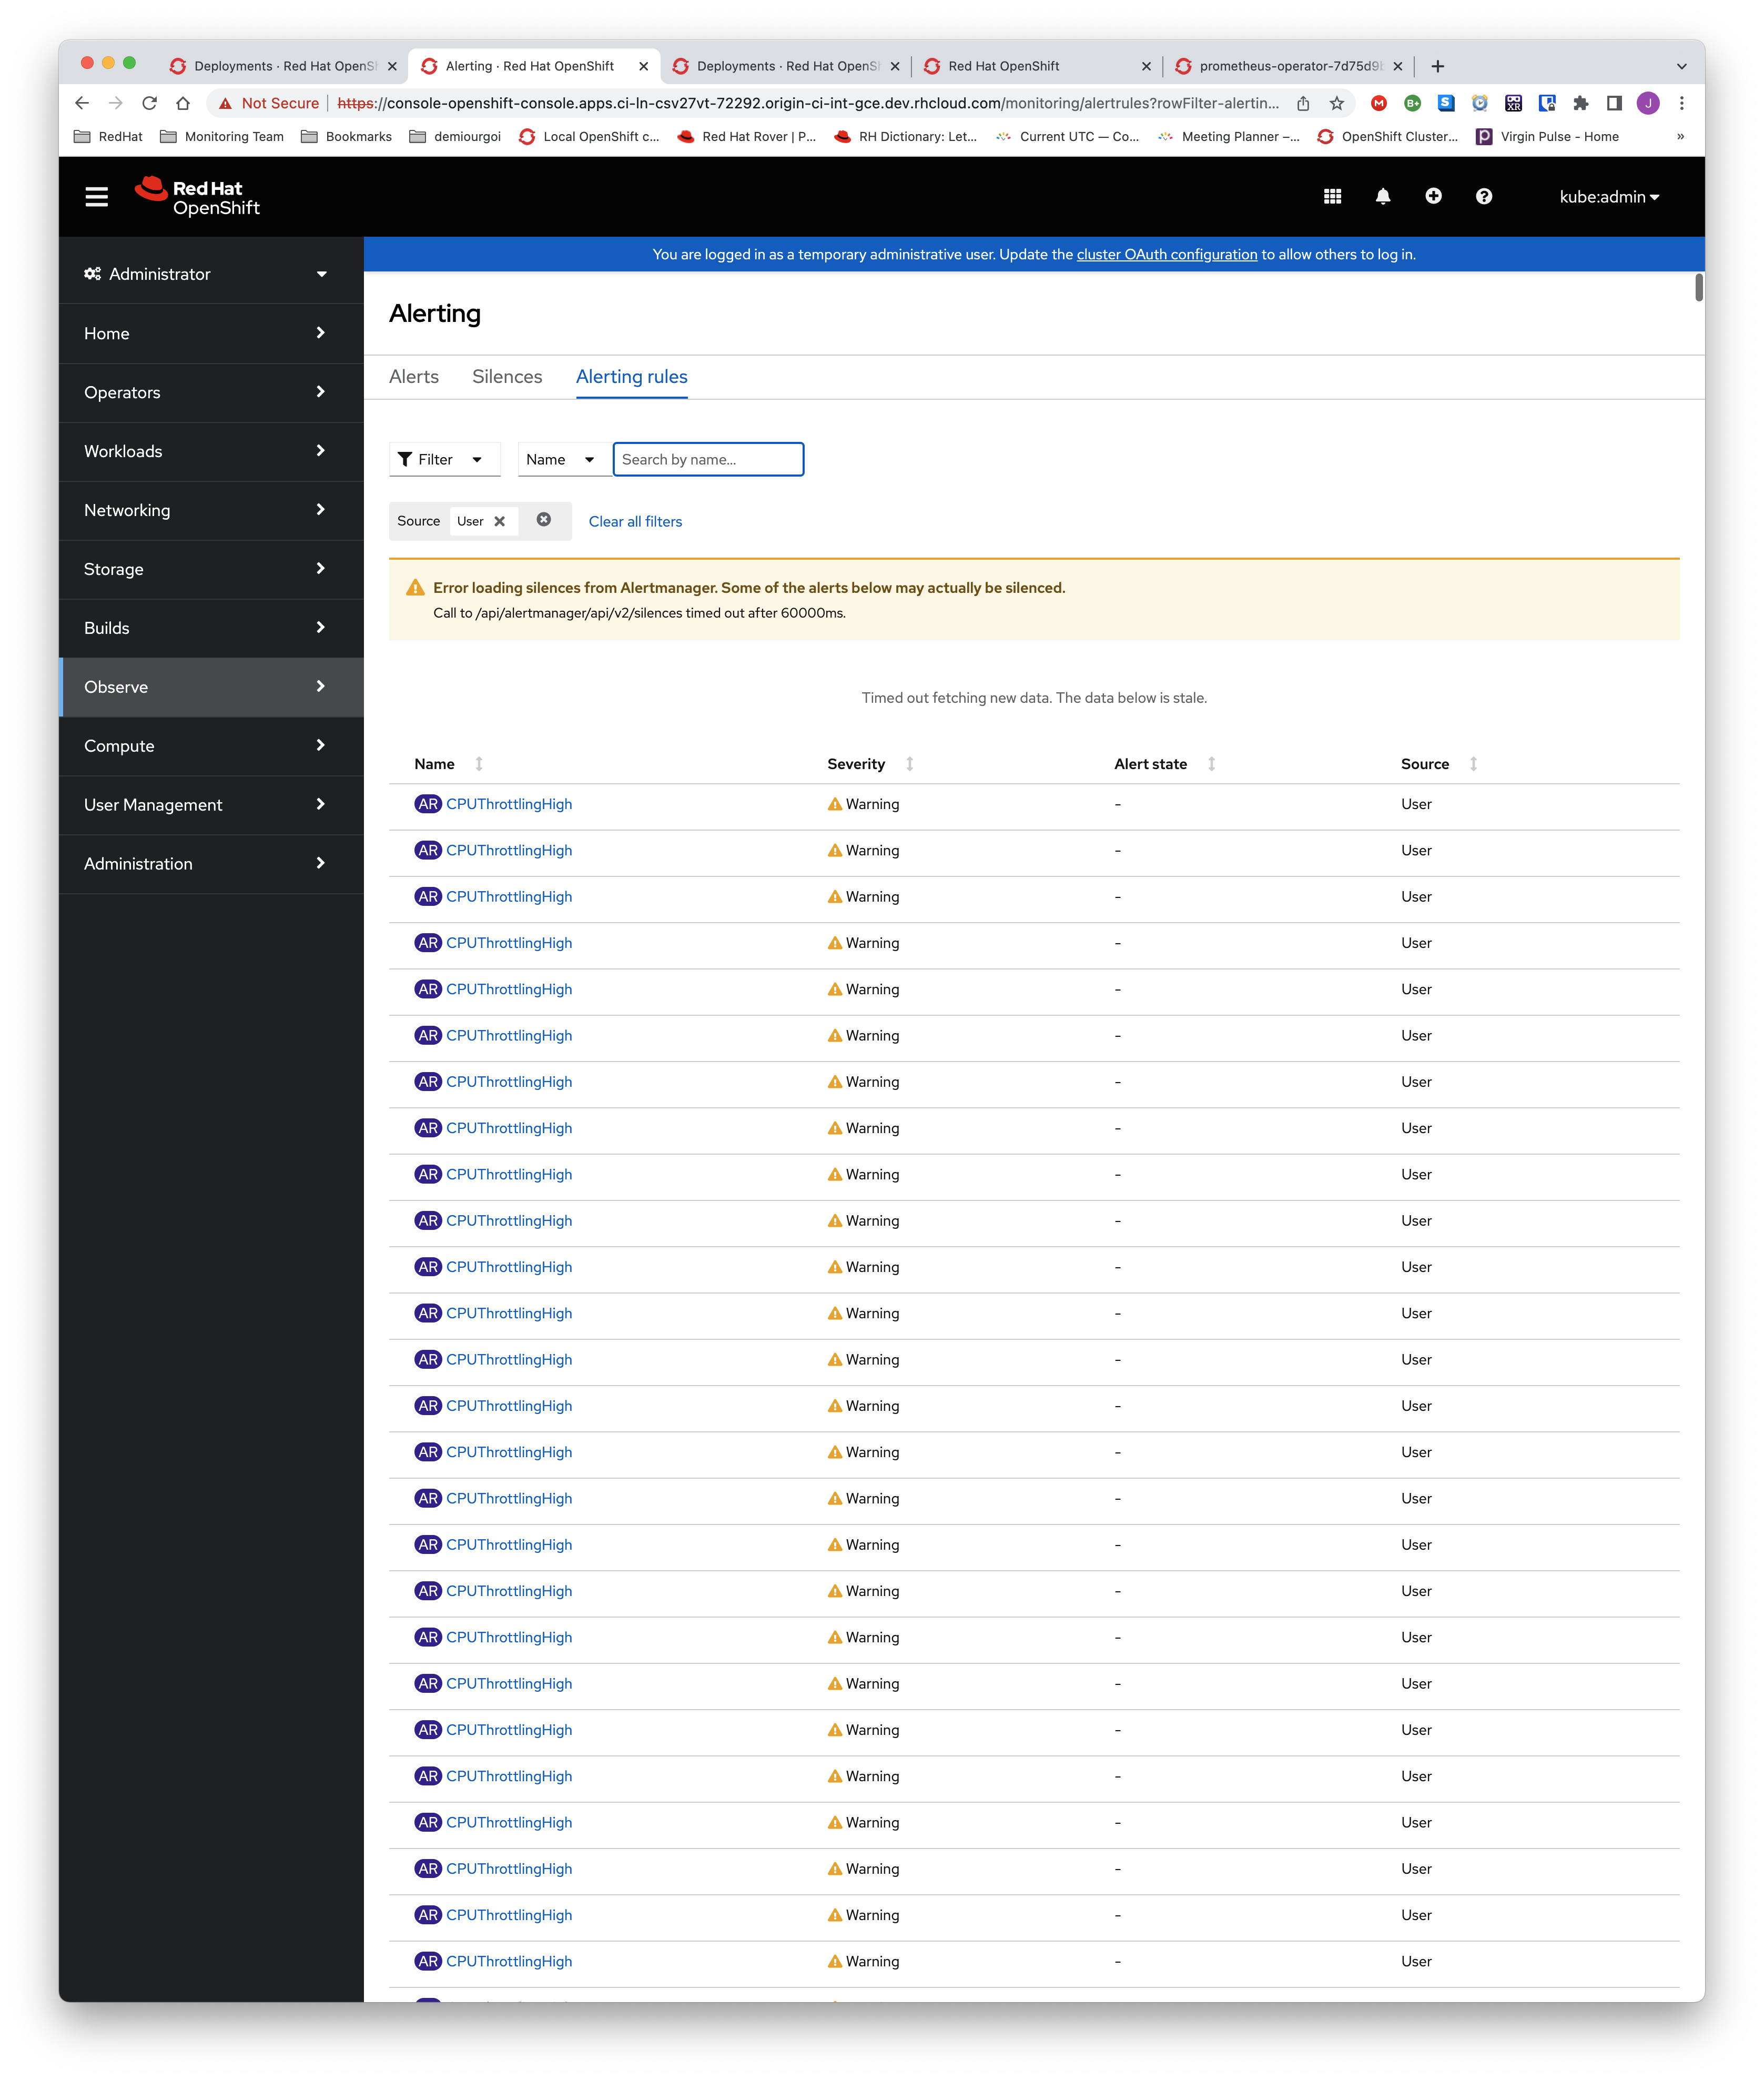
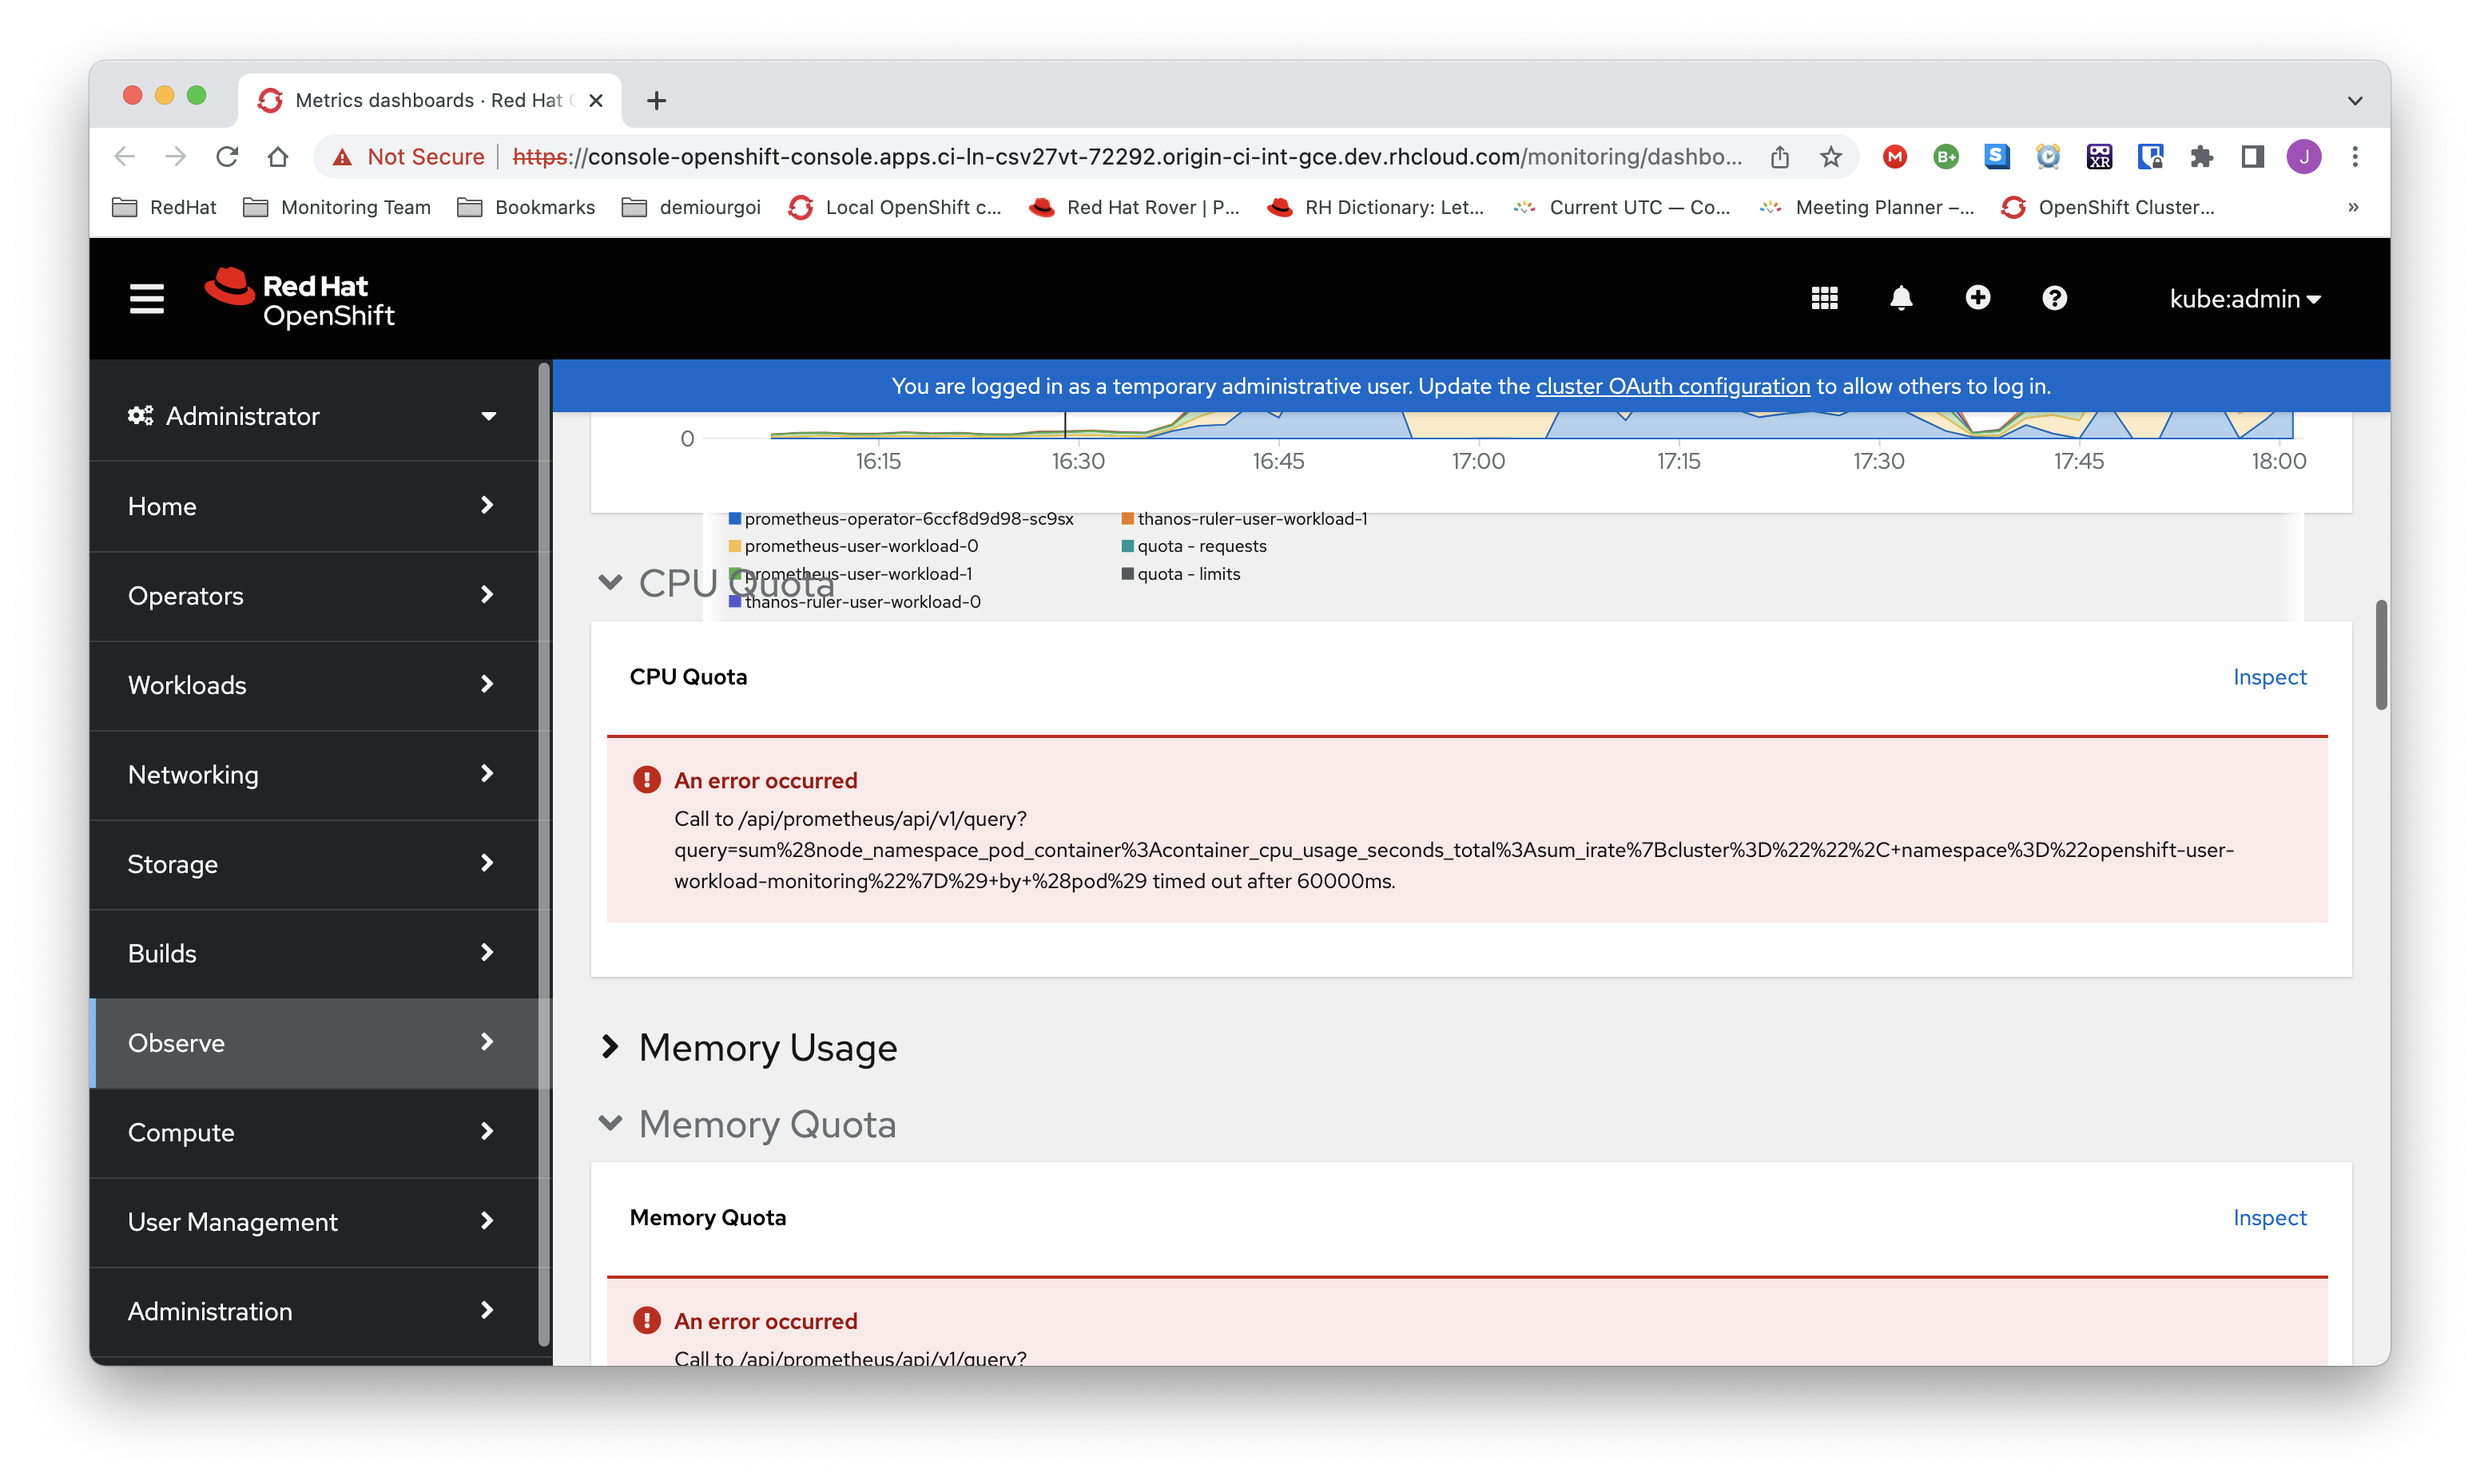
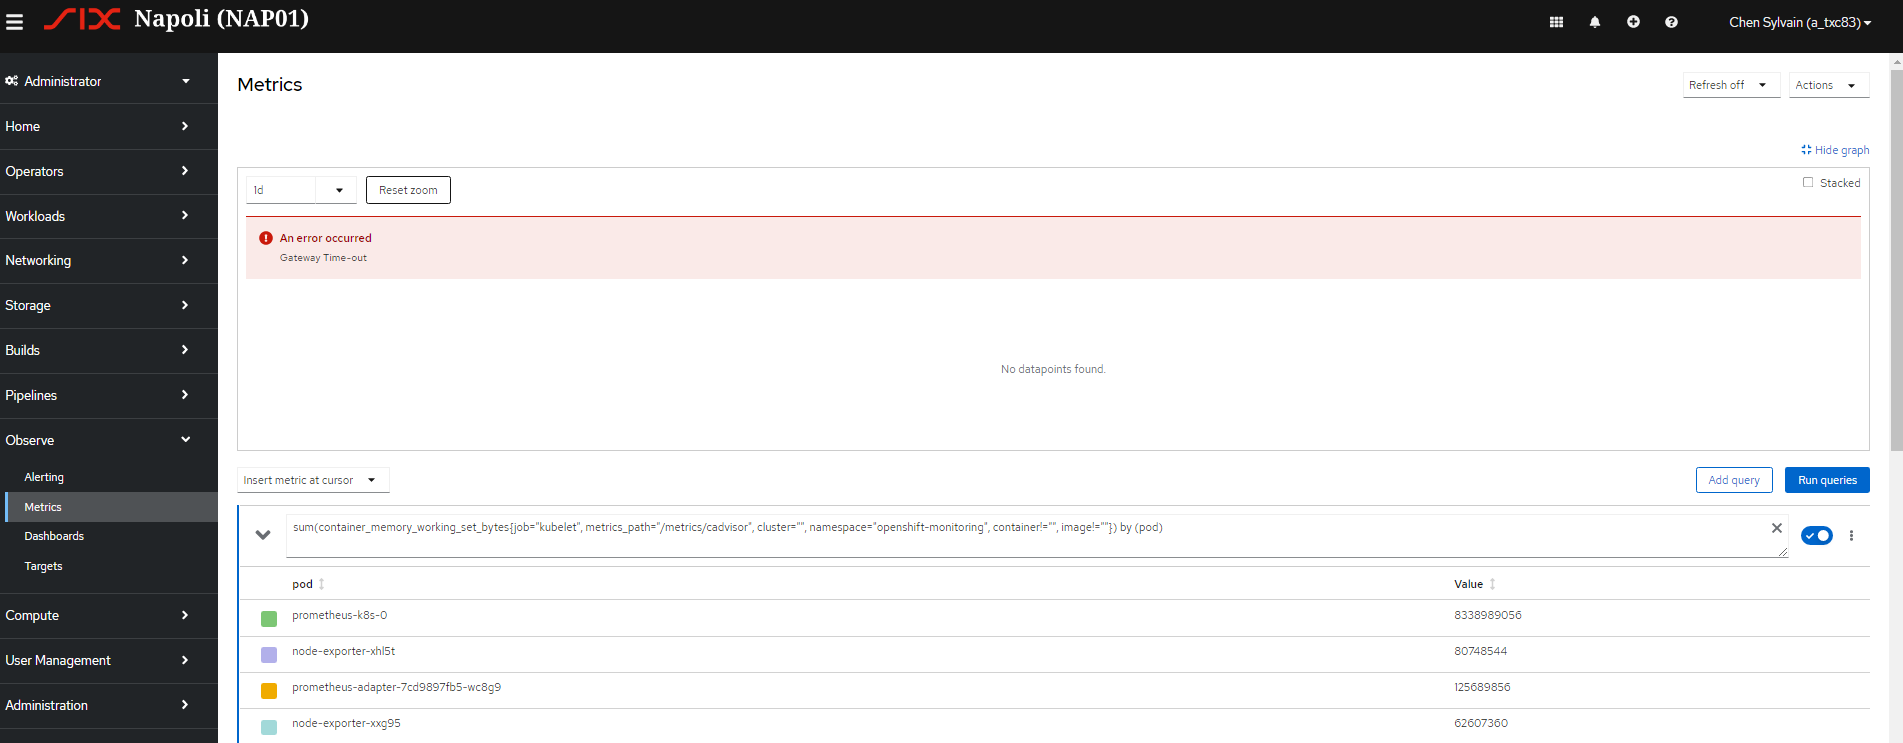
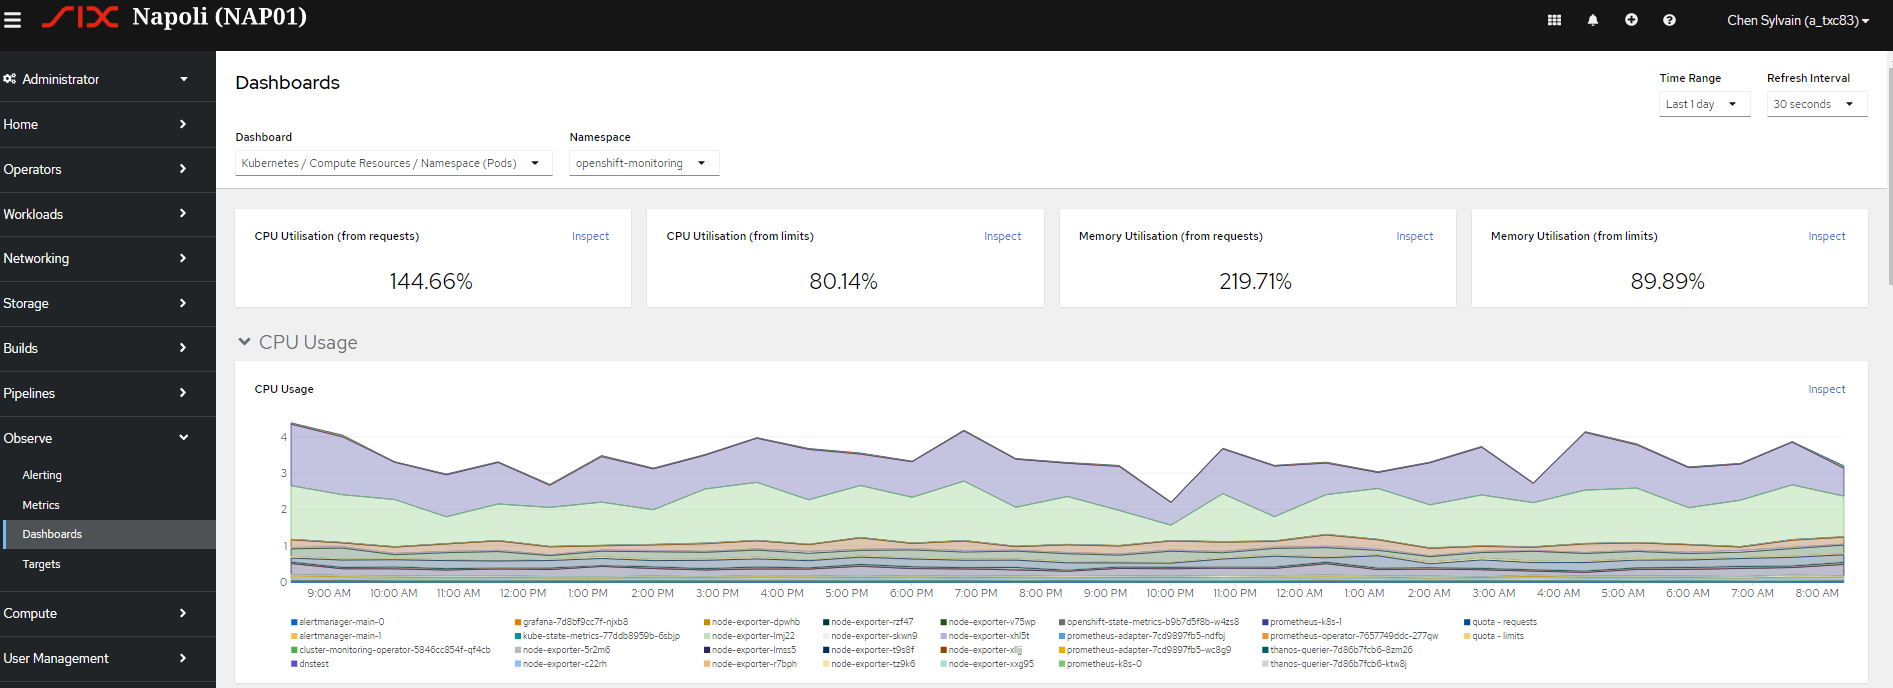
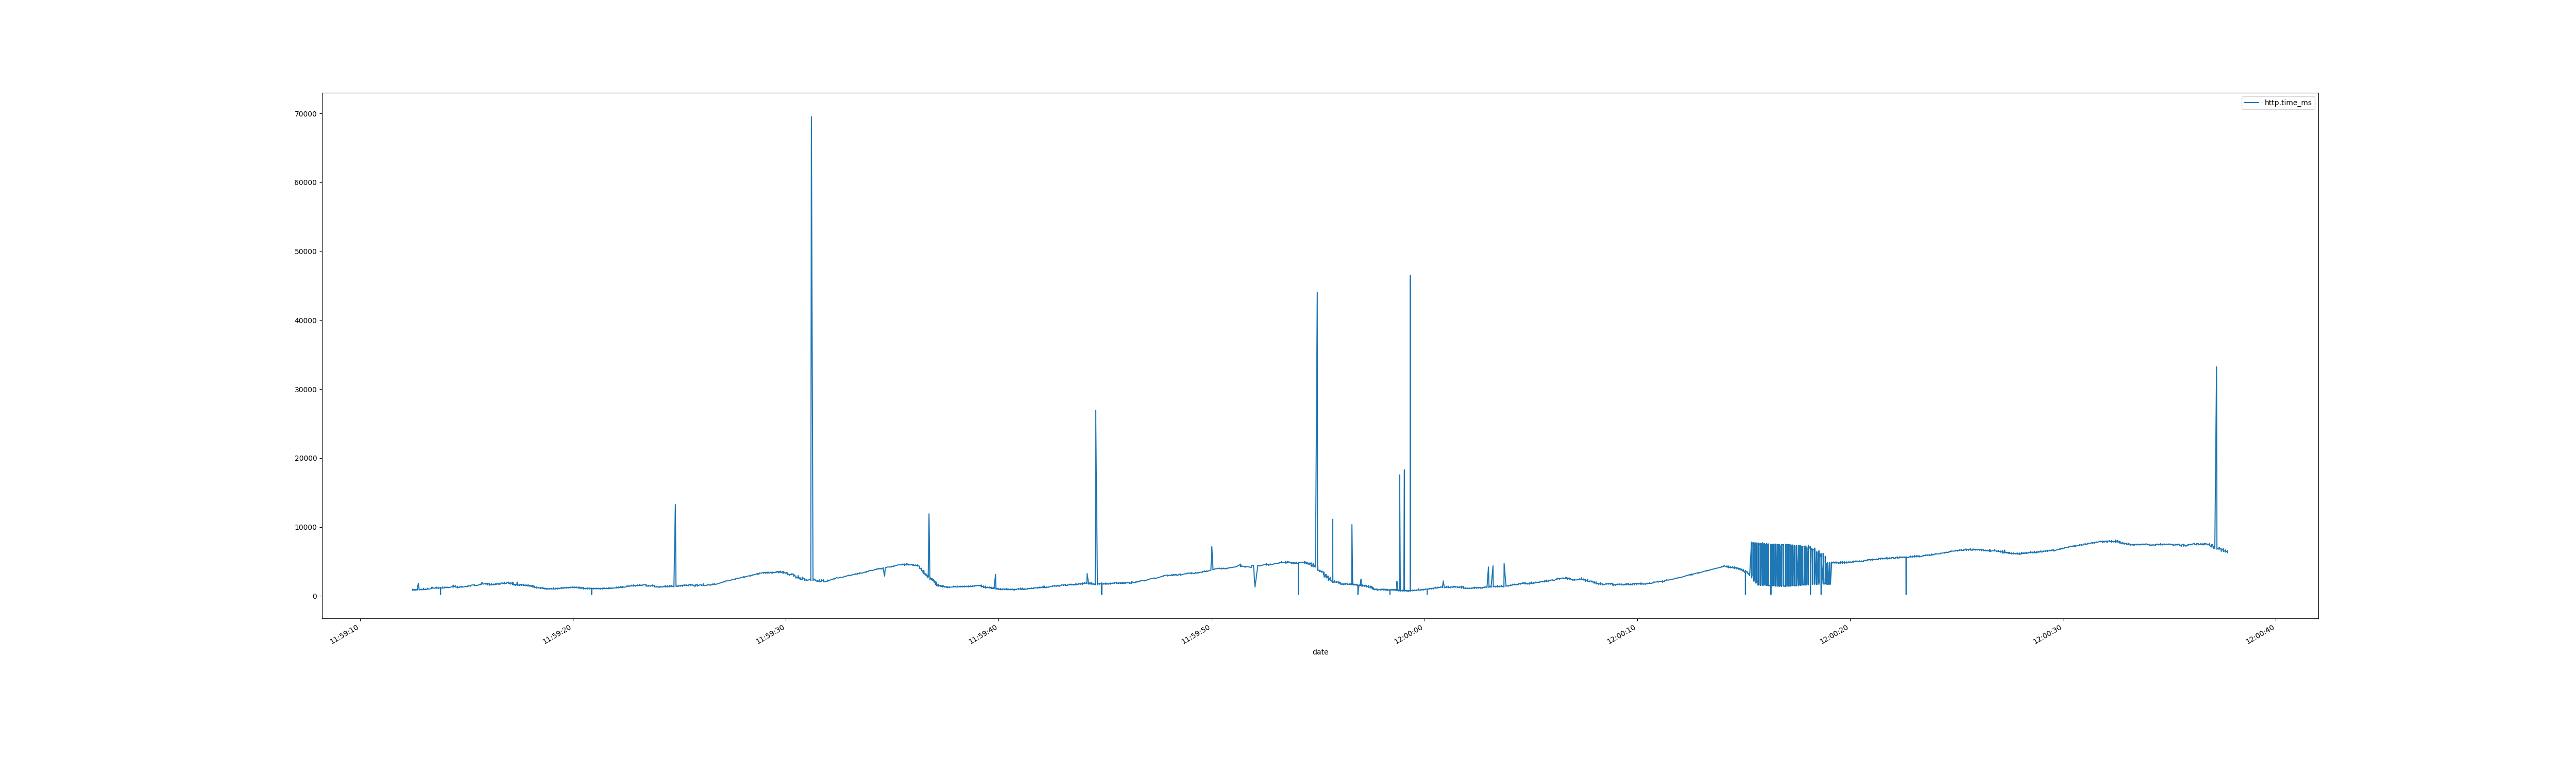
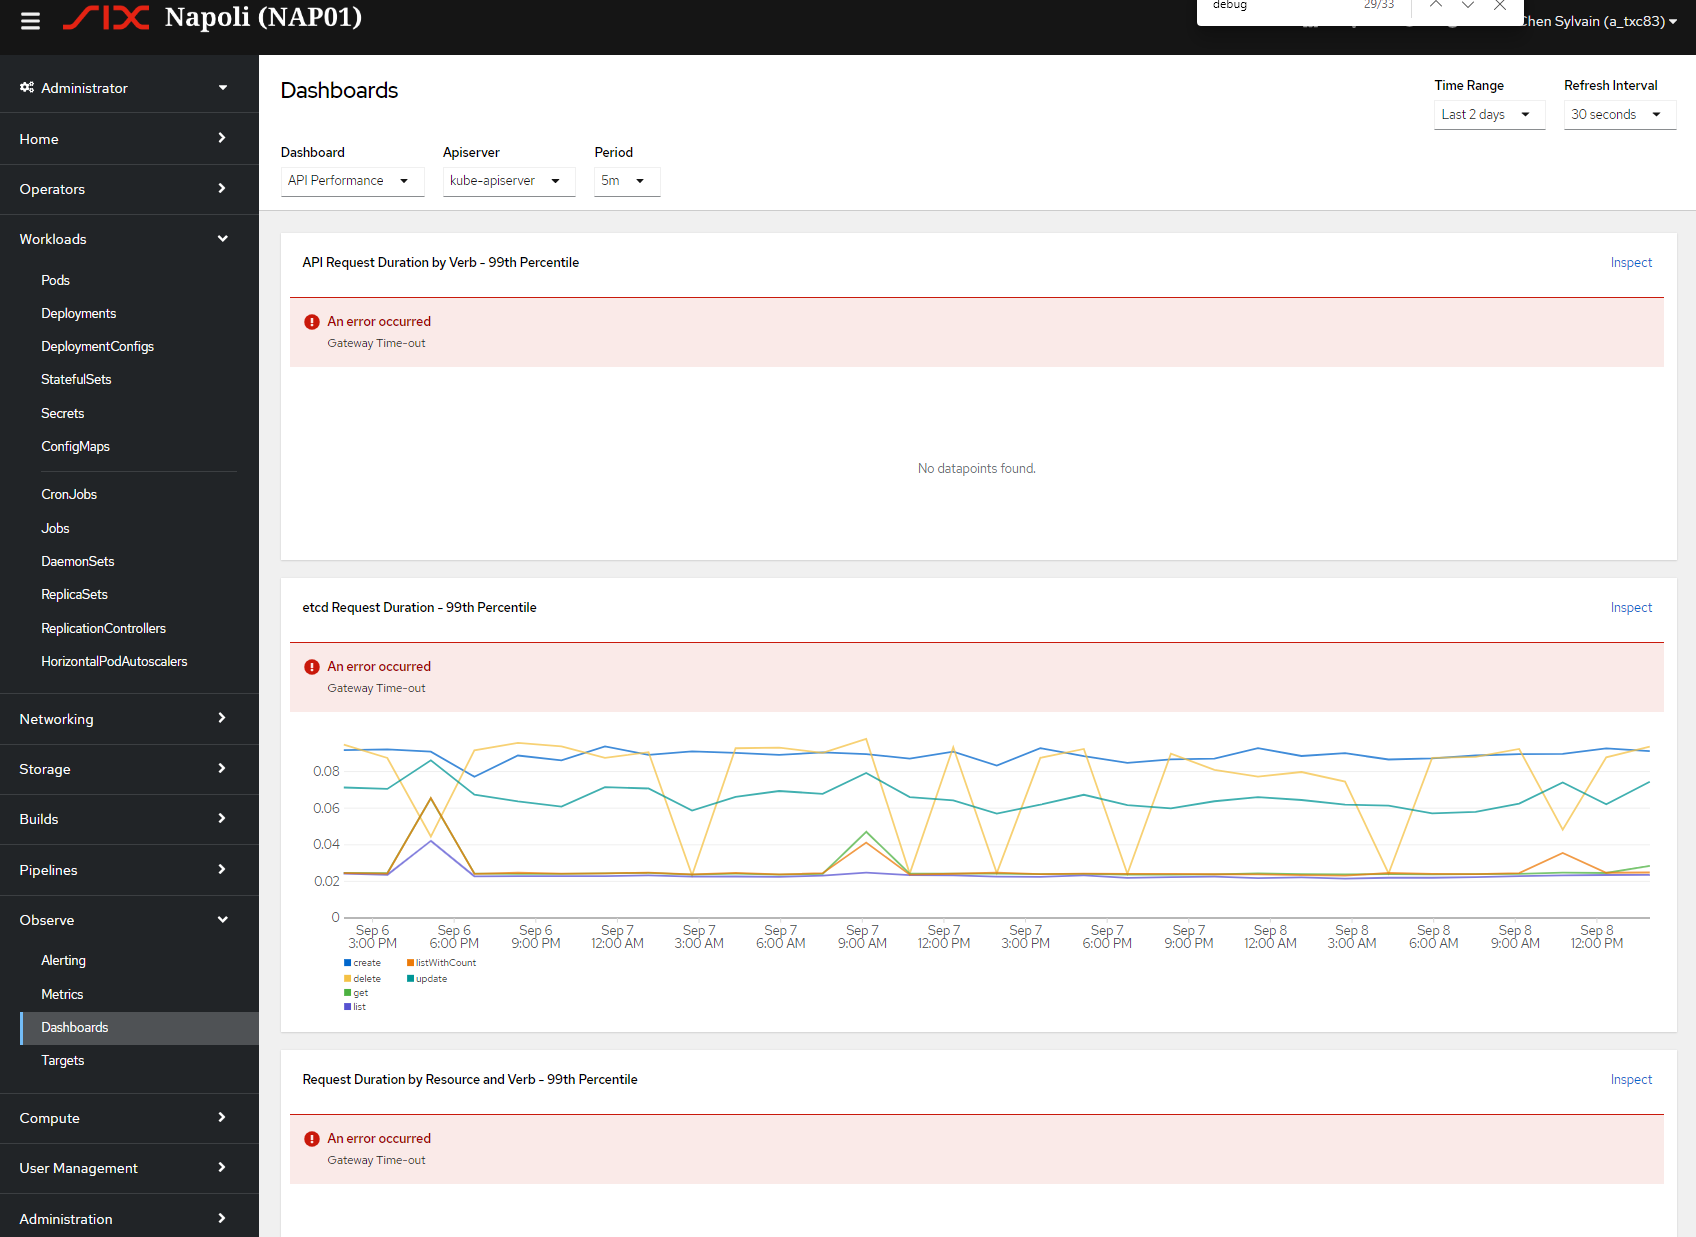
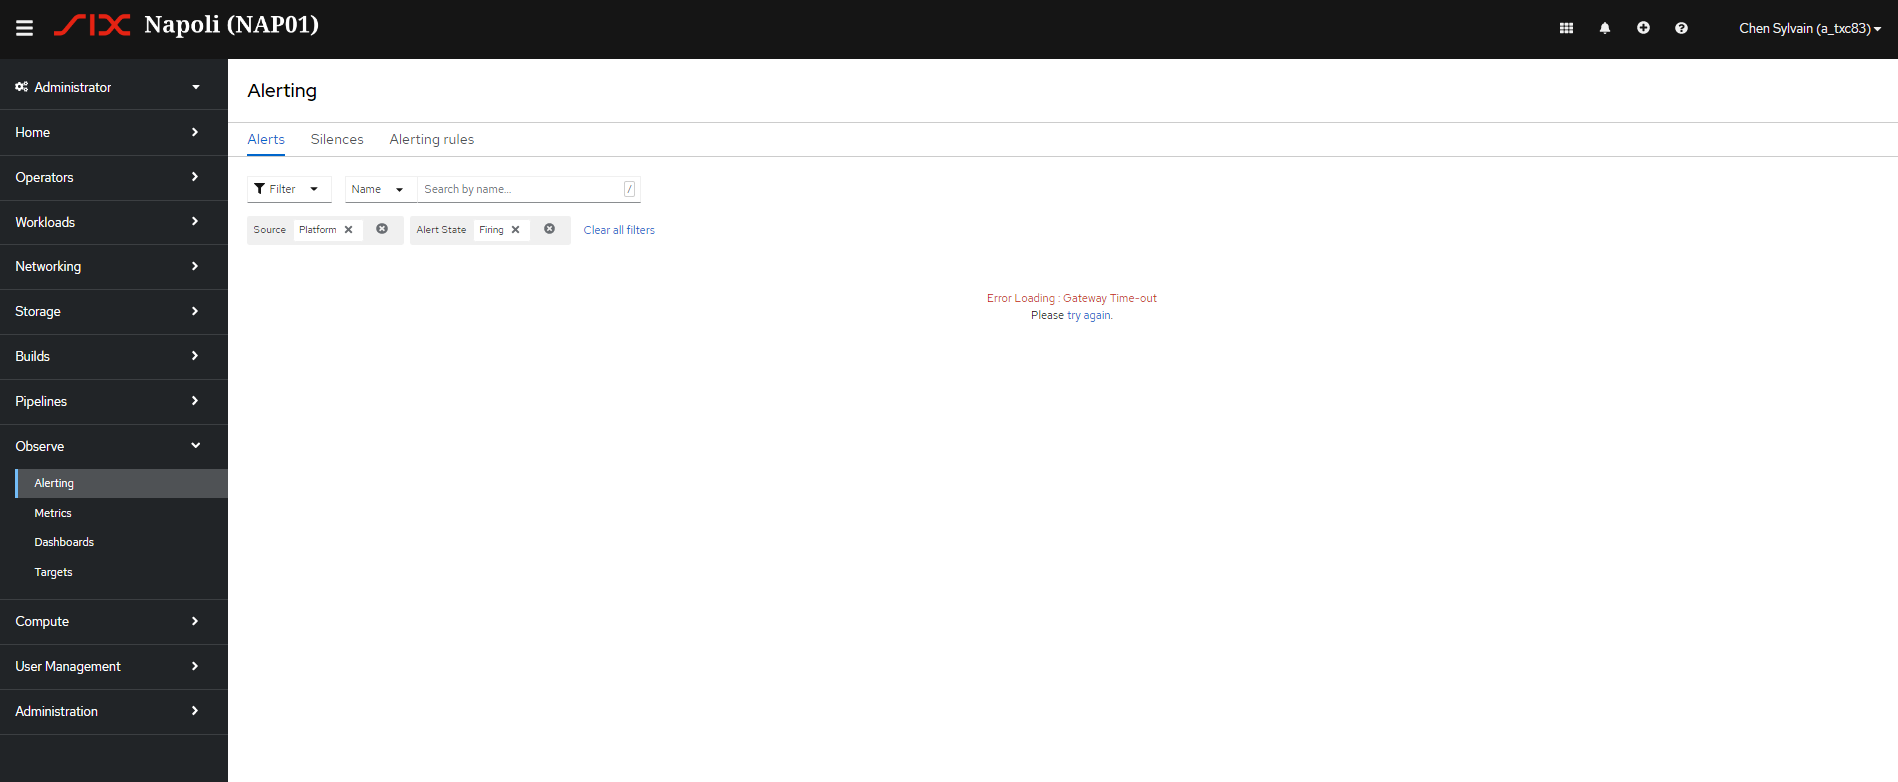
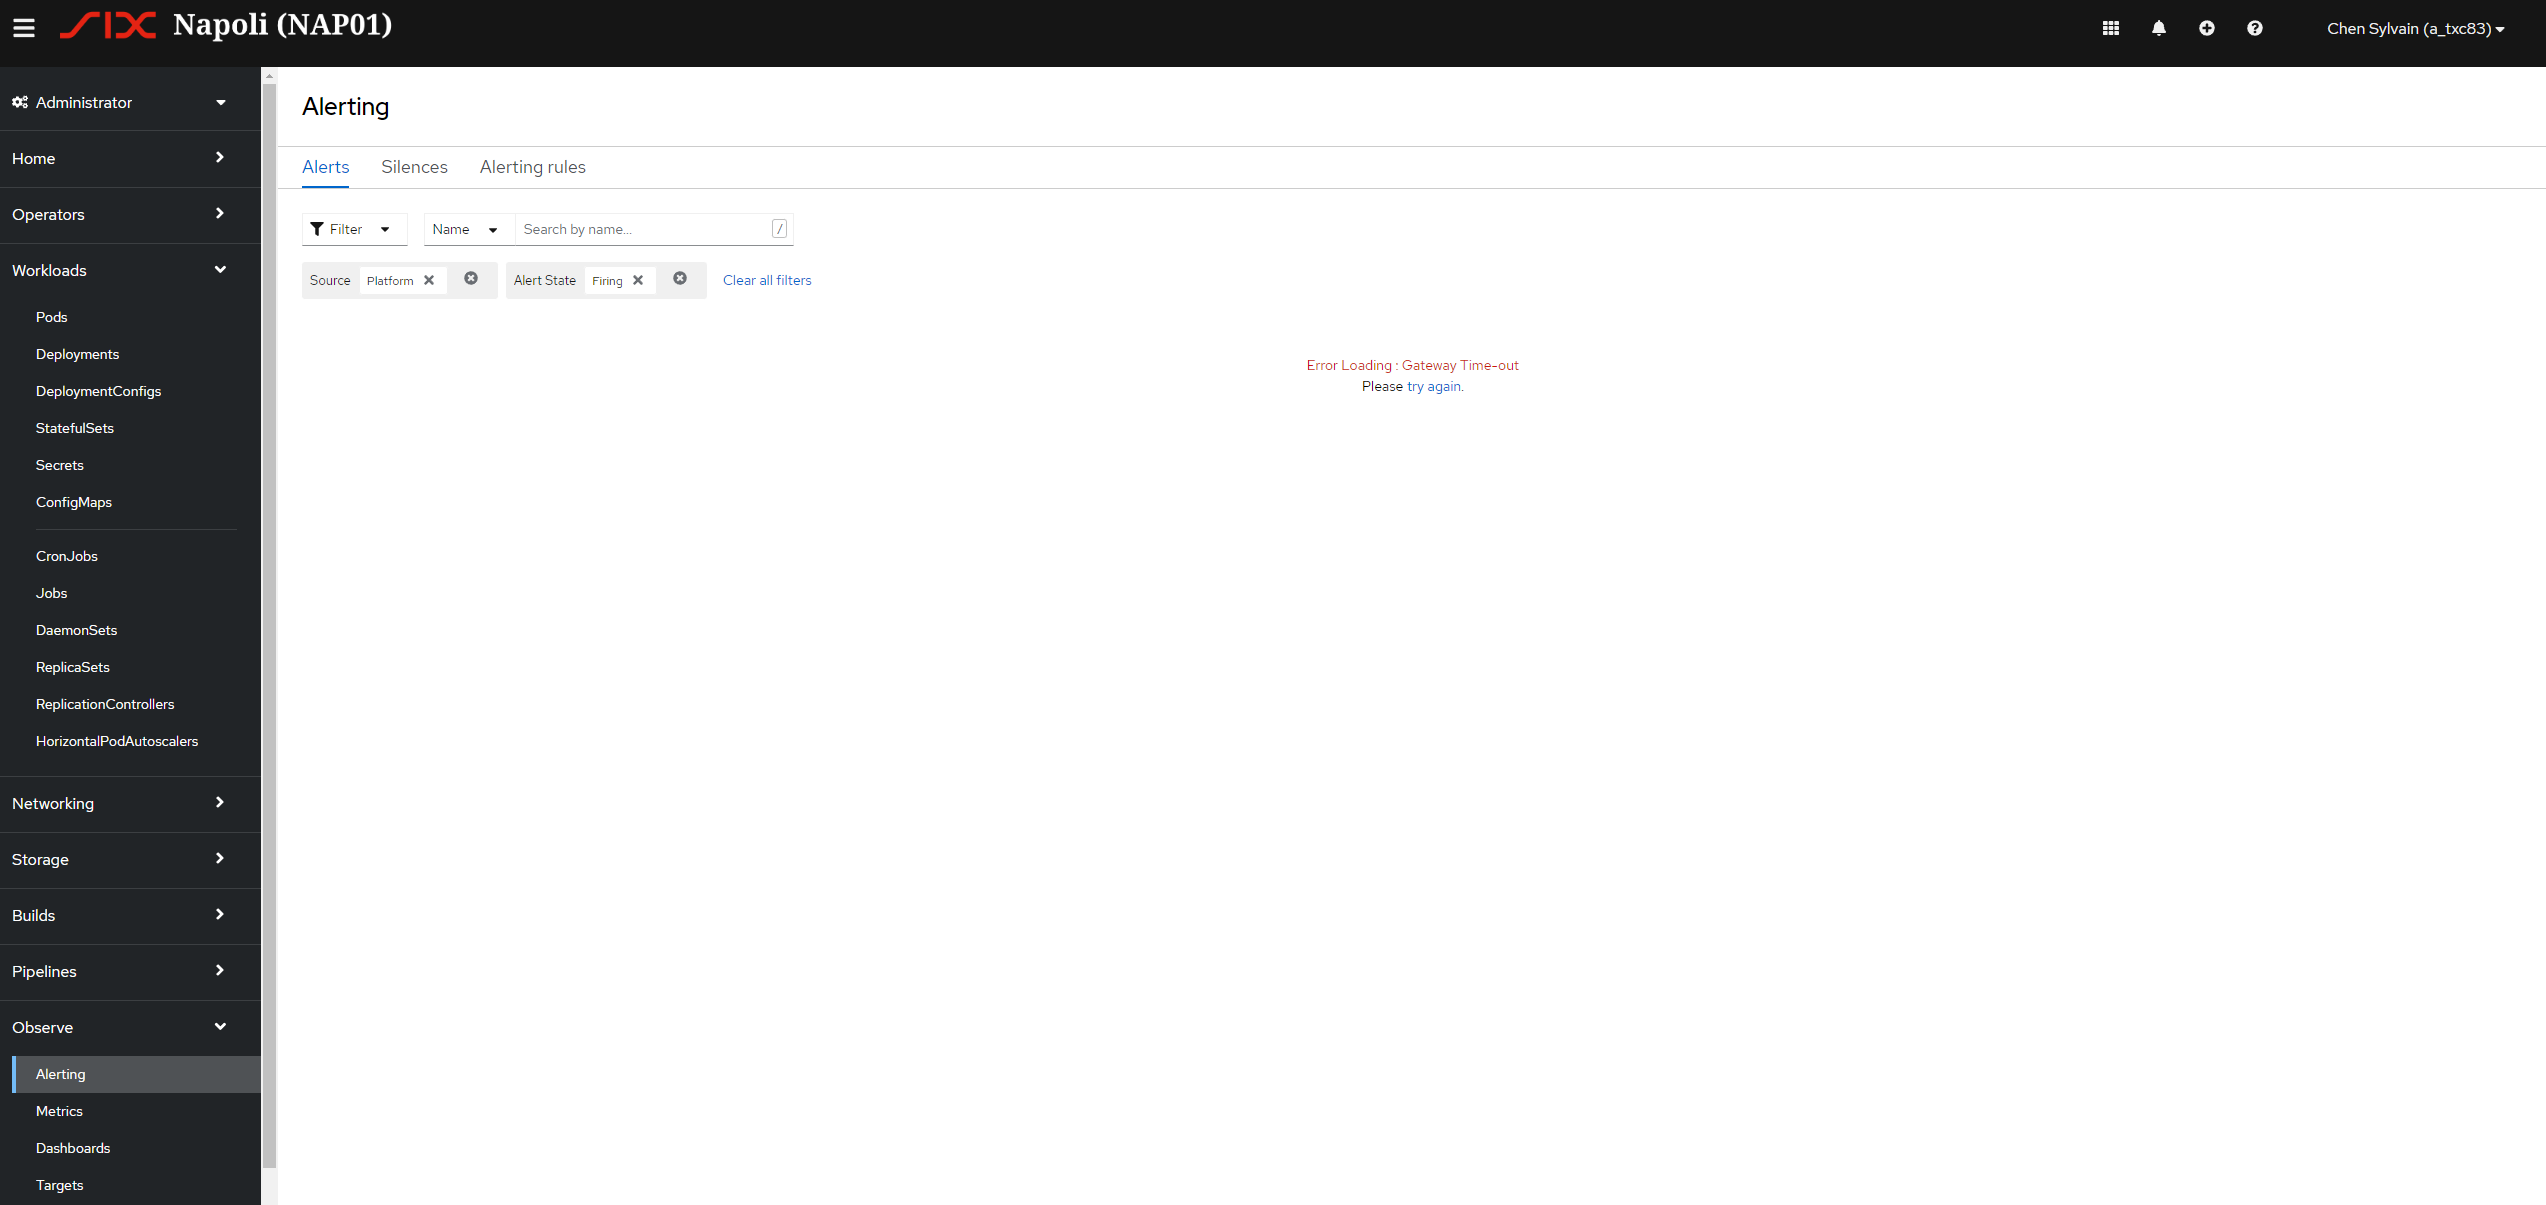
The Alerting tab in Observe panel goes in a stale state regularly Added image
below 4 pods have to be restarted to make them available
prometheus in the user workload namespace
thanos ruler in the user workload namespace
prometheus in openshift-monitoring
thanos-query in openshift-monitoring
- is related to
-
OBSDA-210 Graduate alert overrides and alert relabelings to GA
-

- In Progress
-
- relates to
-
-
- Closed
-
