Uploaded image for project: 'OpenShift Bugs'
  1. OpenShift Bugs
  2. OCPBUGS-612

OpenShift Console Alerting Tab not stable

XMLWordPrintable

    • -
    • None
    • MON Sprint 227, MON Sprint 228, MON Sprint 229
    • 3
    • Rejected
    • False
    • Hide

      None

      Show
      None
    • Customer Escalated

      Hello,

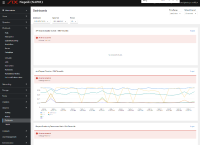
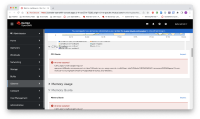
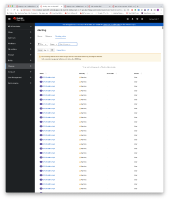
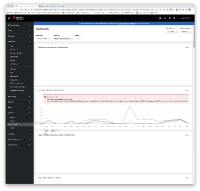
      The Alerting tab in Observe panel goes in a stale state regularly Added image

      below 4 pods have to be restarted to make them available

      prometheus in the user workload namespace
      thanos ruler in the user workload namespace
      prometheus in openshift-monitoring
      thanos-query in openshift-monitoring

        1. alerting.PNG
          alerting.PNG
          70 kB
        2. alertmanager-timeout.PNG
          alertmanager-timeout.PNG
          41 kB
        3. alerts_could_not_be_loaded.PNG
          alerts_could_not_be_loaded.PNG
          228 kB
        4. dashboard.png
          dashboard.png
          149 kB
        5. dnslookup.txt
          21 kB
        6. dns-lookup.yaml
          1 kB
        7. golang-nslookup-cgo-disabled.log
          8.60 MB
        8. golang-nslookup-cgo-enabled.log
          8.55 MB
        9. http.time_ms-series.png
          http.time_ms-series.png
          130 kB
        10. inflight.PNG
          inflight.PNG
          106 kB
        11. nap_prometheusrules_20221017.yaml.gz
          71 kB
        12. nap01_thanos_pod.yaml
          21 kB
        13. nslookup.log
          5.24 MB
        14. prom-cpu.PNG
          prom-cpu.PNG
          163 kB
        15. prom-CPU-after-setting-higher-limits.PNG
          prom-CPU-after-setting-higher-limits.PNG
          160 kB
        16. prom-dashboard.PNG
          prom-dashboard.PNG
          178 kB
        17. prom-memory.PNG
          prom-memory.PNG
          59 kB
        18. Reproduction-2022-09-15 at 18.02.14.png
          Reproduction-2022-09-15 at 18.02.14.png
          897 kB
        19. Reproduction-2022-09-15 at 18.02.39.png
          Reproduction-2022-09-15 at 18.02.39.png
          1.69 MB
        20. Reproduction-2022-09-15 at 18.02.46.png
          Reproduction-2022-09-15 at 18.02.46.png
          1.75 MB
        21. thanos_querier_pod_1_metrics.PNG
          thanos_querier_pod_1_metrics.PNG
          87 kB
        22. thanos_querier_pod_2_metrics.PNG
          thanos_querier_pod_2_metrics.PNG
          85 kB
        23. thanos_query_logs_pod1.log
          208 kB
        24. thanos_query_logs_pod2.log
          150 kB
        25. thanos-golang.log
          7.77 MB
        26. thanos-max-queries.PNG
          thanos-max-queries.PNG
          74 kB
        27. thanos-miekgdns.log
          7.87 MB
        28. thanos-querier-0912-2022.log
          3.71 MB
        29. thanos-querier-0912-2022-1.log
          17.23 MB
        30. thanos-querier-1.log
          36.24 MB
        31. thanos-querier-1209.log
          15.64 MB
        32. thanos-querier-1209-1.log
          40.36 MB
        33. thanos-querier-2.log
          17.18 MB
        34. thanos-querier-7d86b7fcb6-8zm26-describe.txt
          16 kB
        35. thanos-querier-describe-0912-2022.txt
          17 kB
        36. thanos-queries-in-flights.PNG
          thanos-queries-in-flights.PNG
          109 kB
        37. timeout.PNG
          timeout.PNG
          189 kB
        38. user-workload-cpu-memory.PNG
          user-workload-cpu-memory.PNG
          113 kB
        39. user-workload-dashboard.PNG
          user-workload-dashboard.PNG
          145 kB

              jfajersk@redhat.com Jan Fajerski
              rhn-support-ssonigra Sonigra Saurab
              Junqi Zhao Junqi Zhao
              Votes:
              0 Vote for this issue
              Watchers:
              13 Start watching this issue

                Created:
                Updated:
                Resolved: