Uploaded image for project: 'Network Observability'
  1. Network Observability
  2. NETOBSERV-696

Reporter node behaves the opposite of what it says

Details

    • Bug
    • Resolution: Done
    • Major
    • netobserv-1.2
    • netobserv-ocp4.12
    • None
    • None
    • False
    • None
    • False
    • Hide
      Previously, the "reporter" option in the console plugin, which is used to filter flows based on the observation point (source node or destination node), did sometimes mix flows regardless that node observation point. This was due to flows being incorrectly reported as being Ingress or Egress at the node level.
      With this patch, the flow direction is now corrected, which allows the "reporter" option to filter for source observation point, or destination observation point, as expected.
      Show
      Previously, the "reporter" option in the console plugin, which is used to filter flows based on the observation point (source node or destination node), did sometimes mix flows regardless that node observation point. This was due to flows being incorrectly reported as being Ingress or Egress at the node level. With this patch, the flow direction is now corrected, which allows the "reporter" option to filter for source observation point, or destination observation point, as expected.
    • NetObserv - Sprint 228, NetObserv - Sprint 229, NetObserv - Sprint 230, NetObserv - Sprint 231, NetObserv - Sprint 232
    • Important

    Description

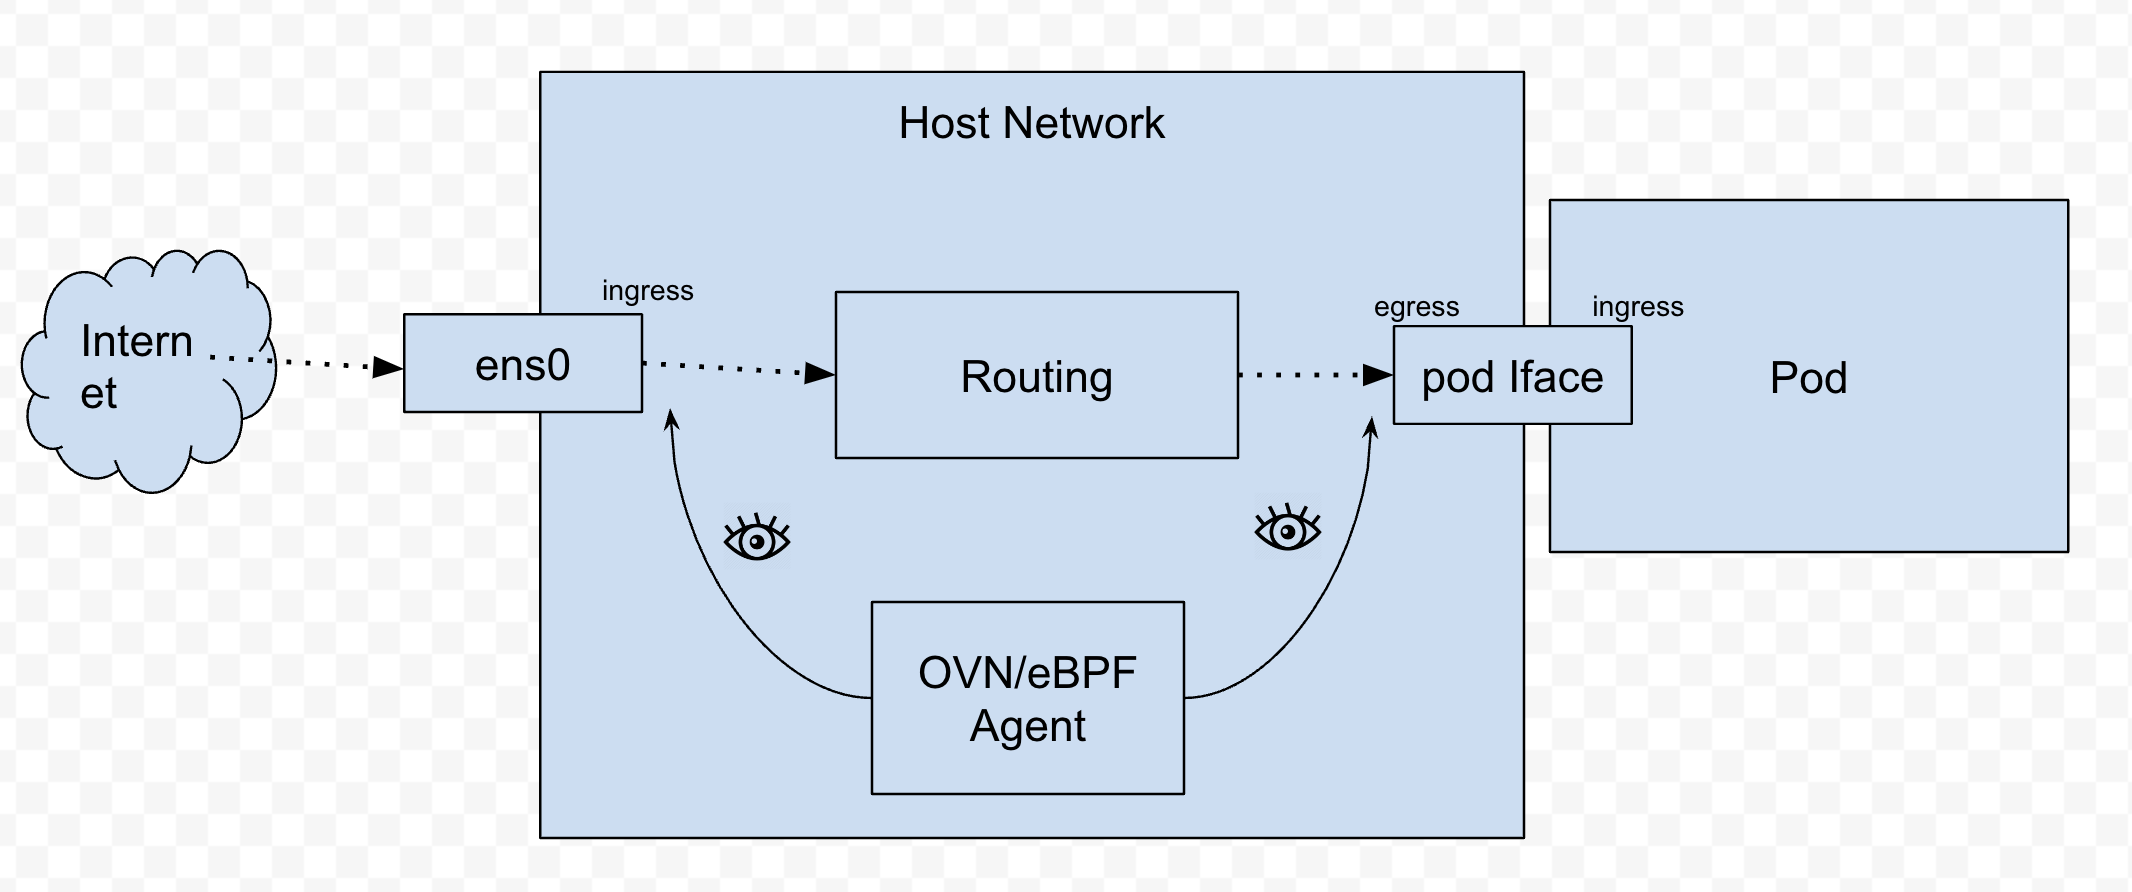
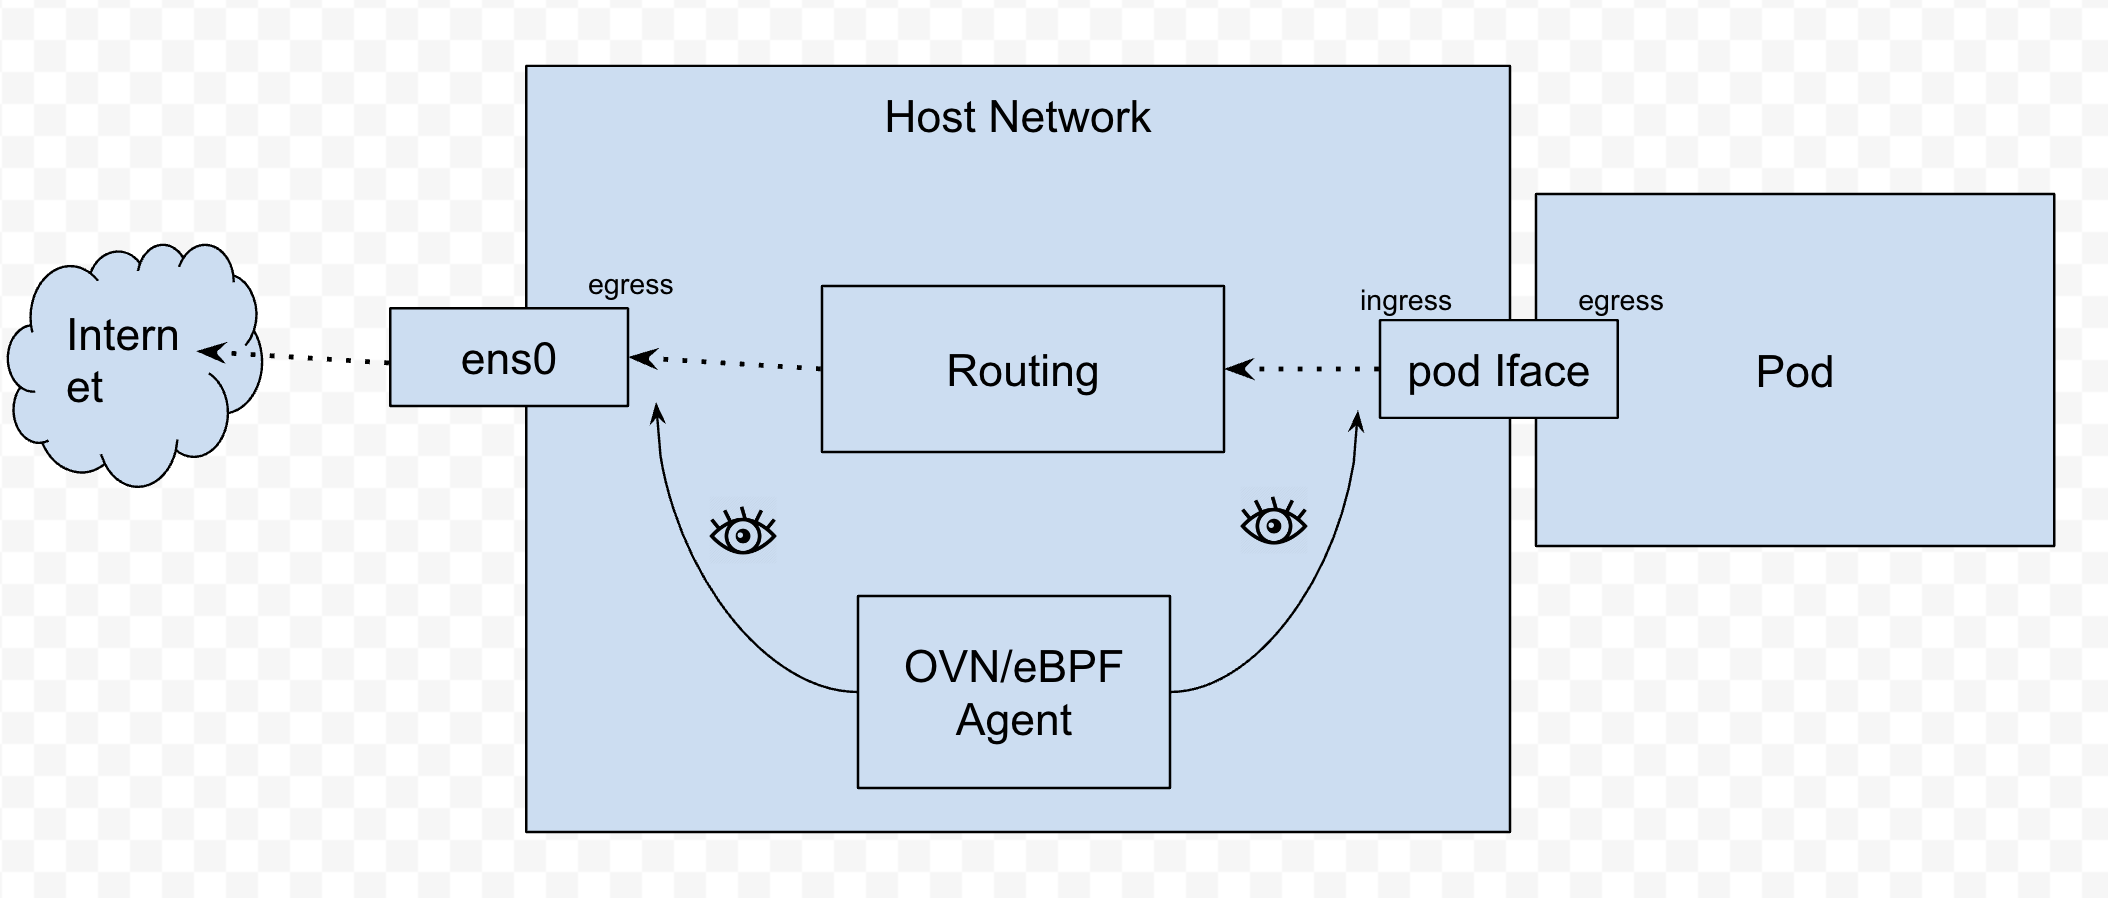
      In Network Traffic. under Query Options, the last sentence in the tooltip for "Reporter node" says:

      Cluster ingress traffic is only reported by destination nodes, and cluster egress by source nodes.

      However, the opposite is happening.

      Steps to reproduce the problem:

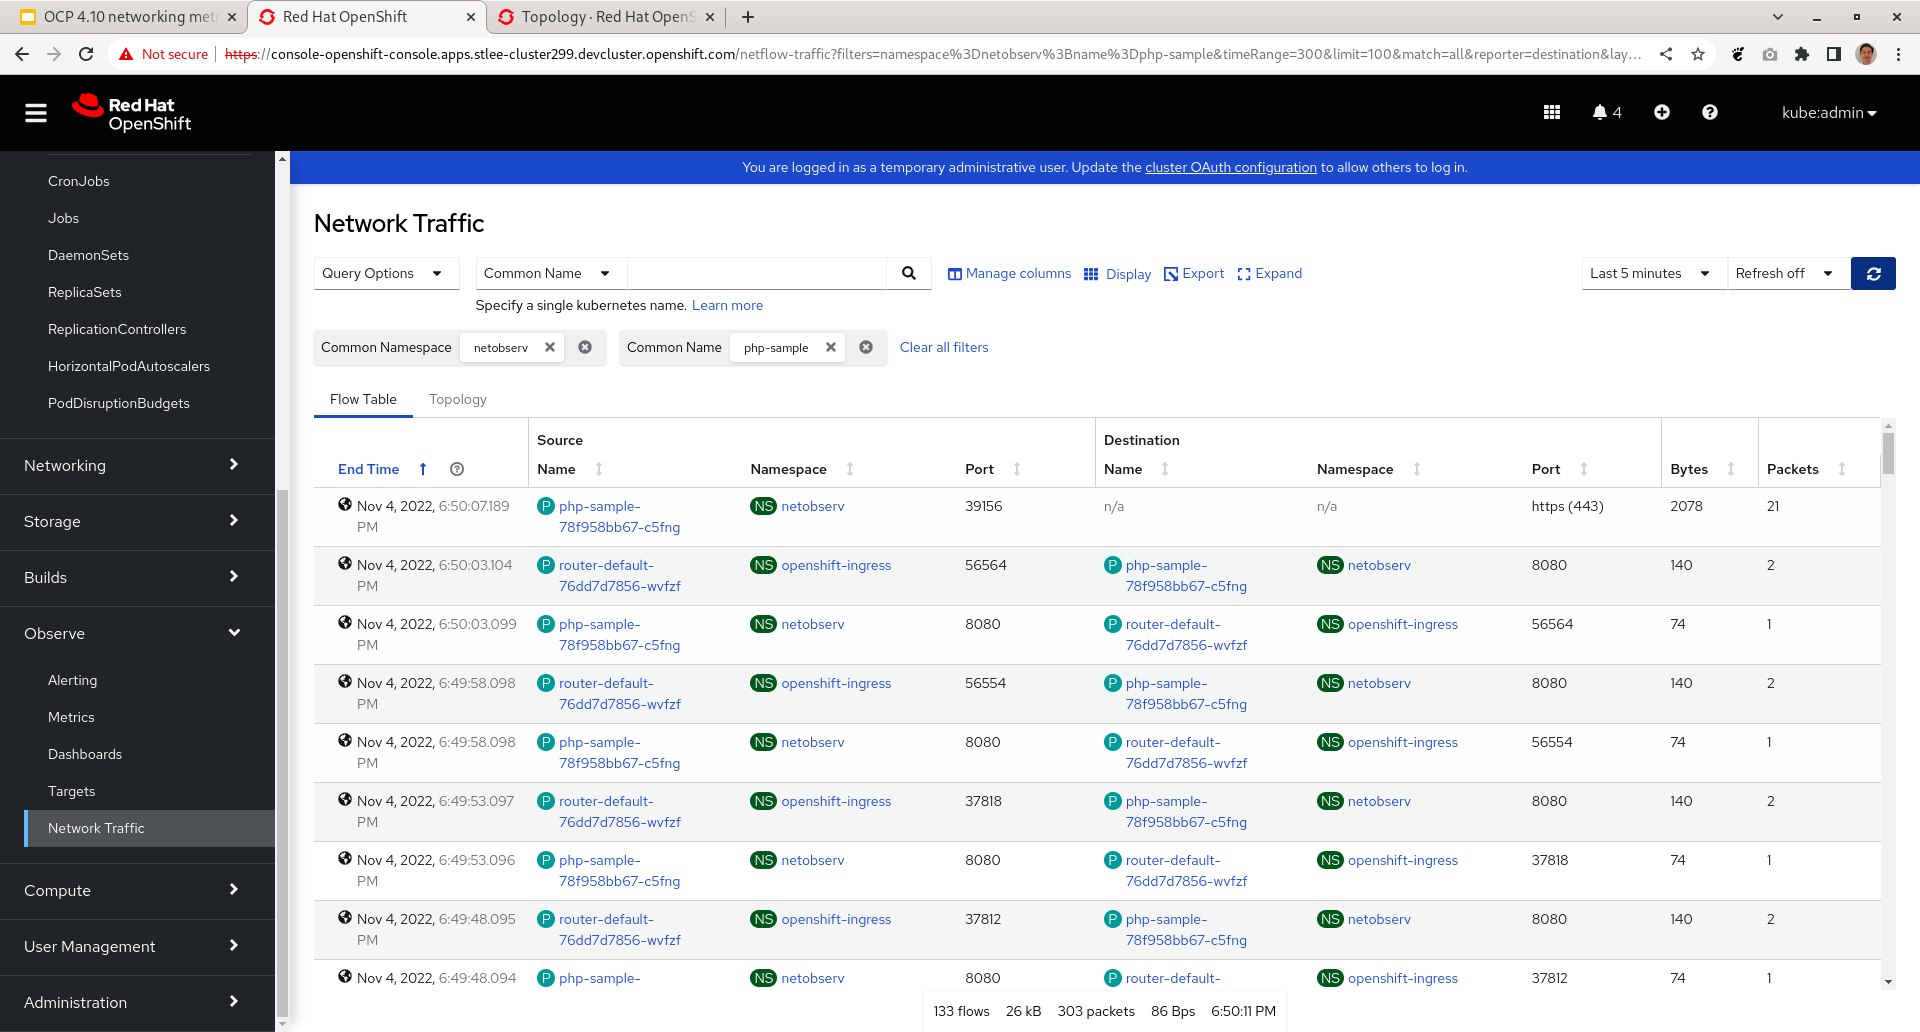
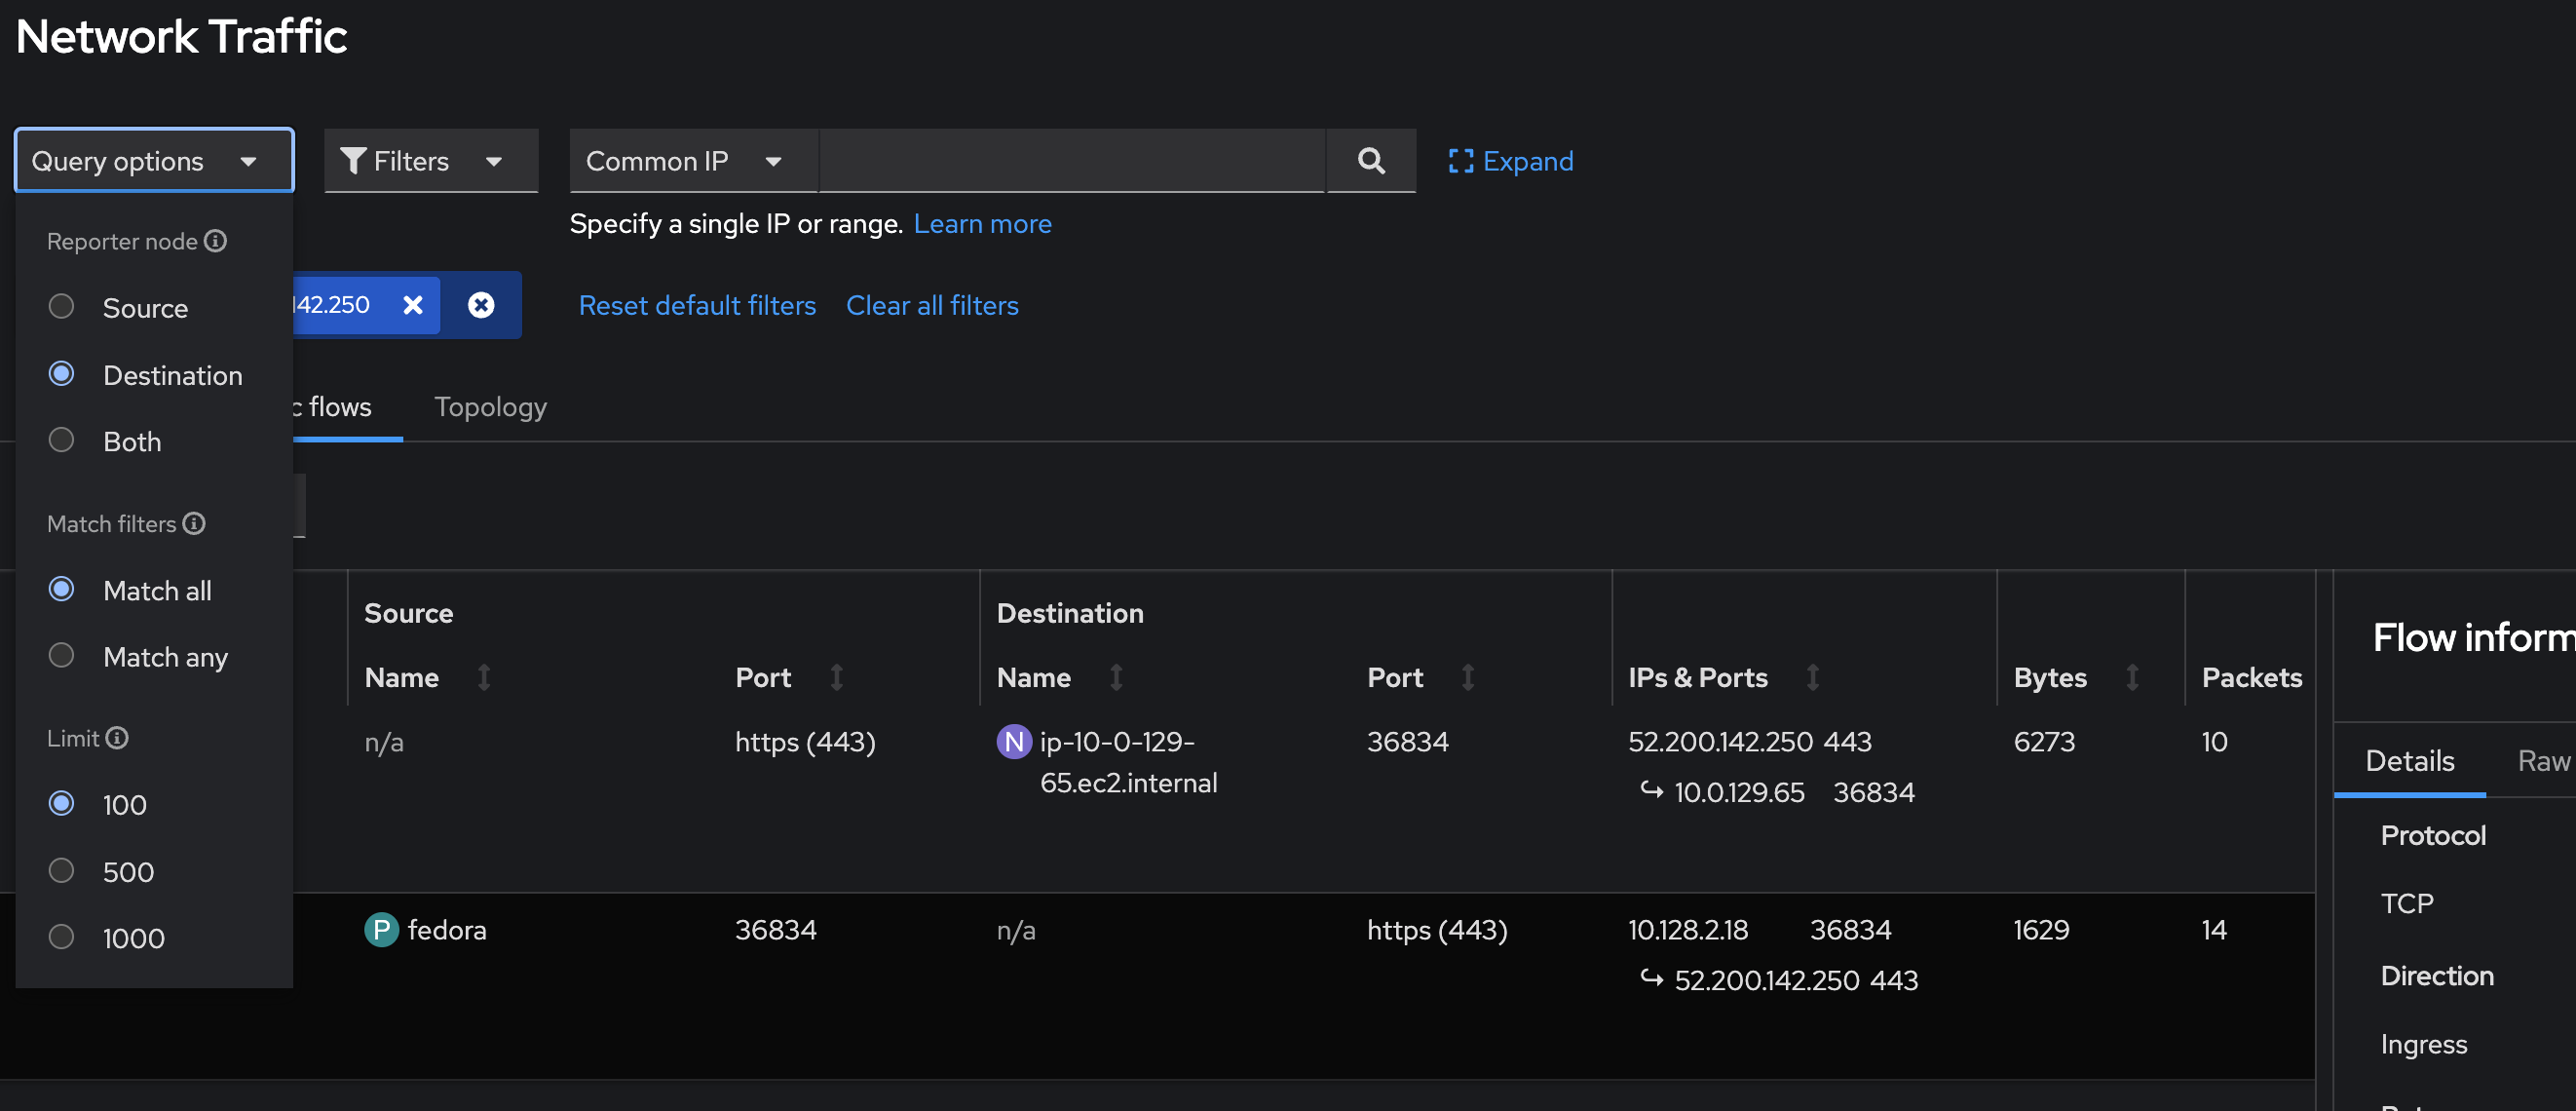
      1. In Network Traffic, in Query Options, select "Destination".  This is the default.
      2. Filter on a pod where you will make a web request.
      3. ssh into that pod.
      4. Make a curl request to a web site.  It's easier to see if you use an IP address to avoid DNS traffic.  Example:
        curl -kL https://52.200.142.250
        
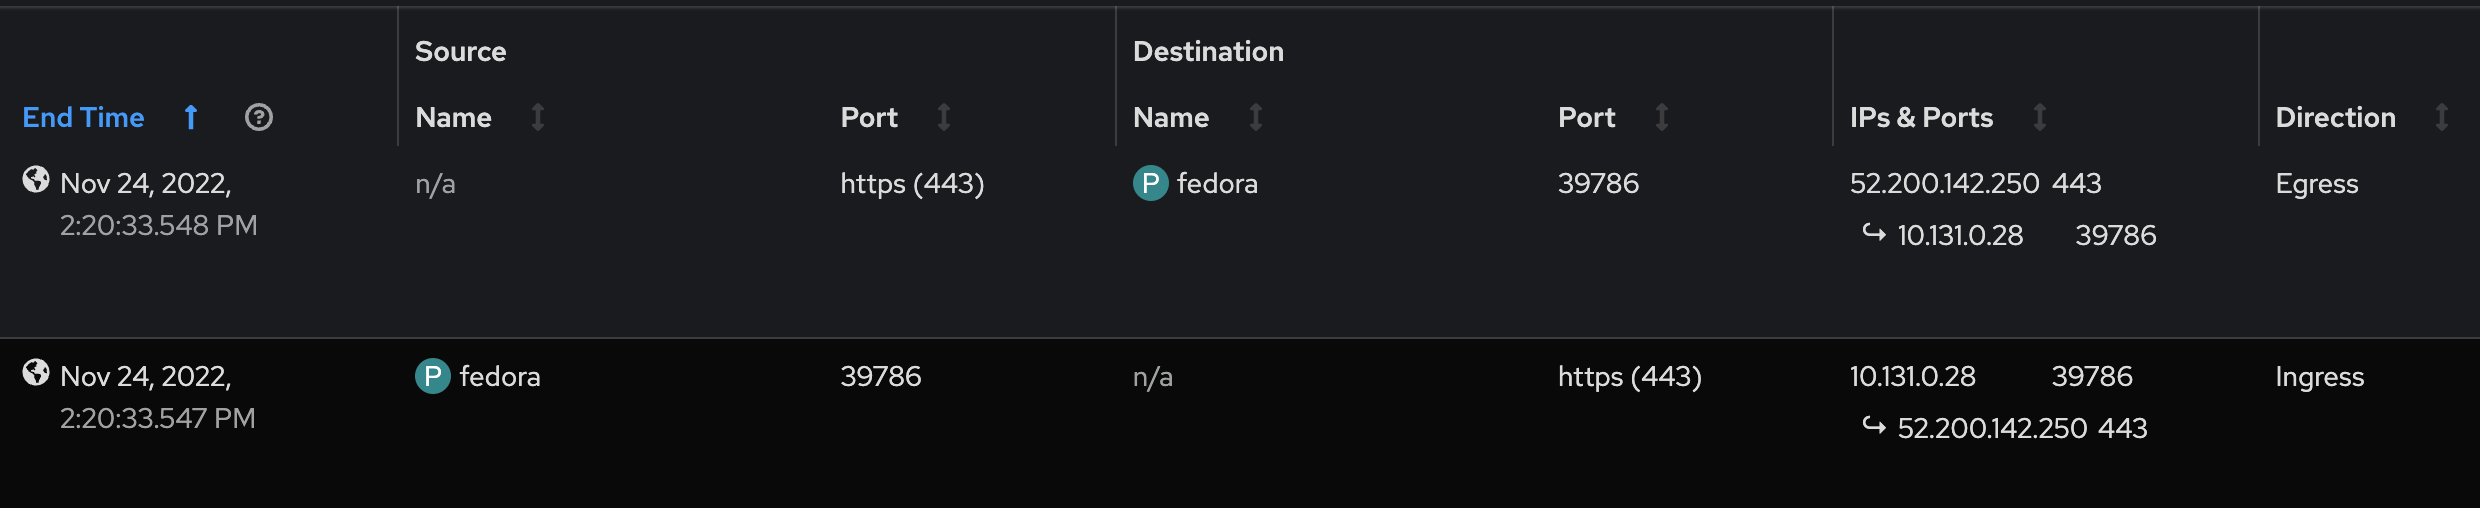
      1. In the Flow table, you will only see traffic from that pod going out to the Internet to dest port 443 (see 01-dest.png, 1st row).  There will be no return traffic.  This means it is the source node reporting egress traffic, even though "Destination" is selected.
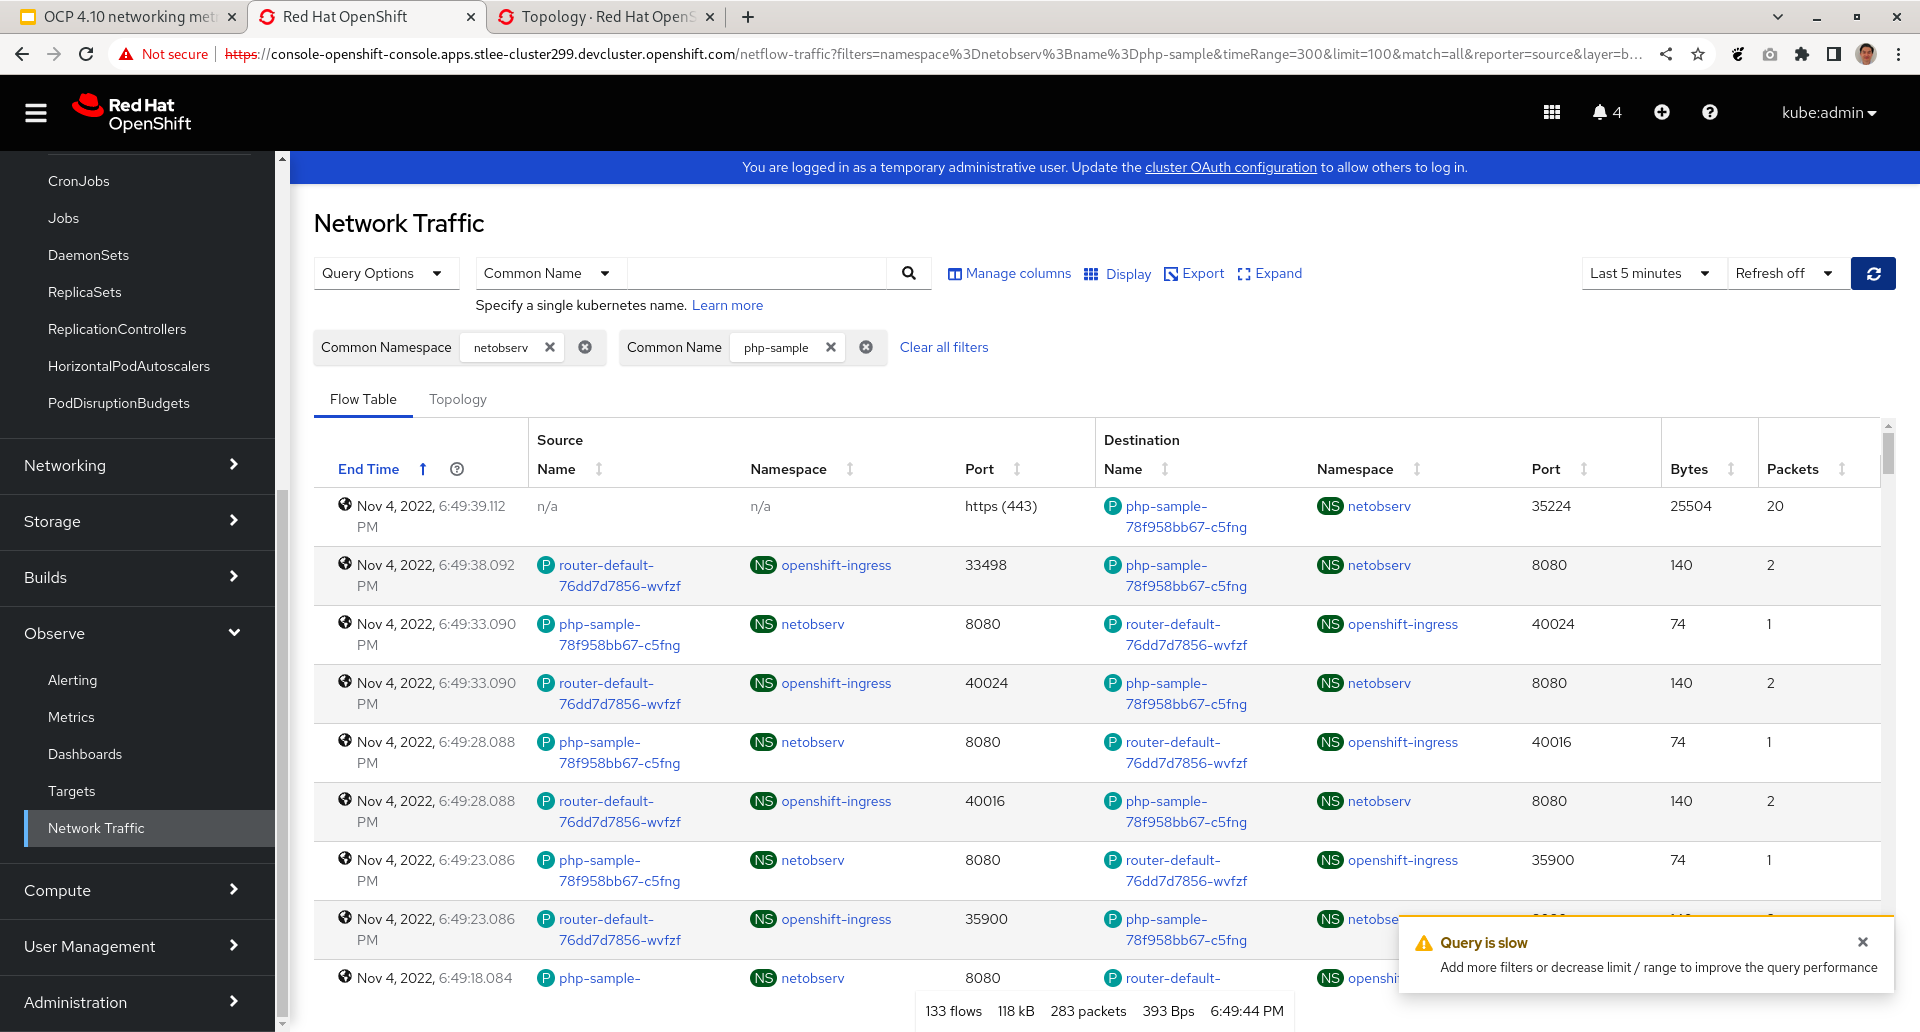
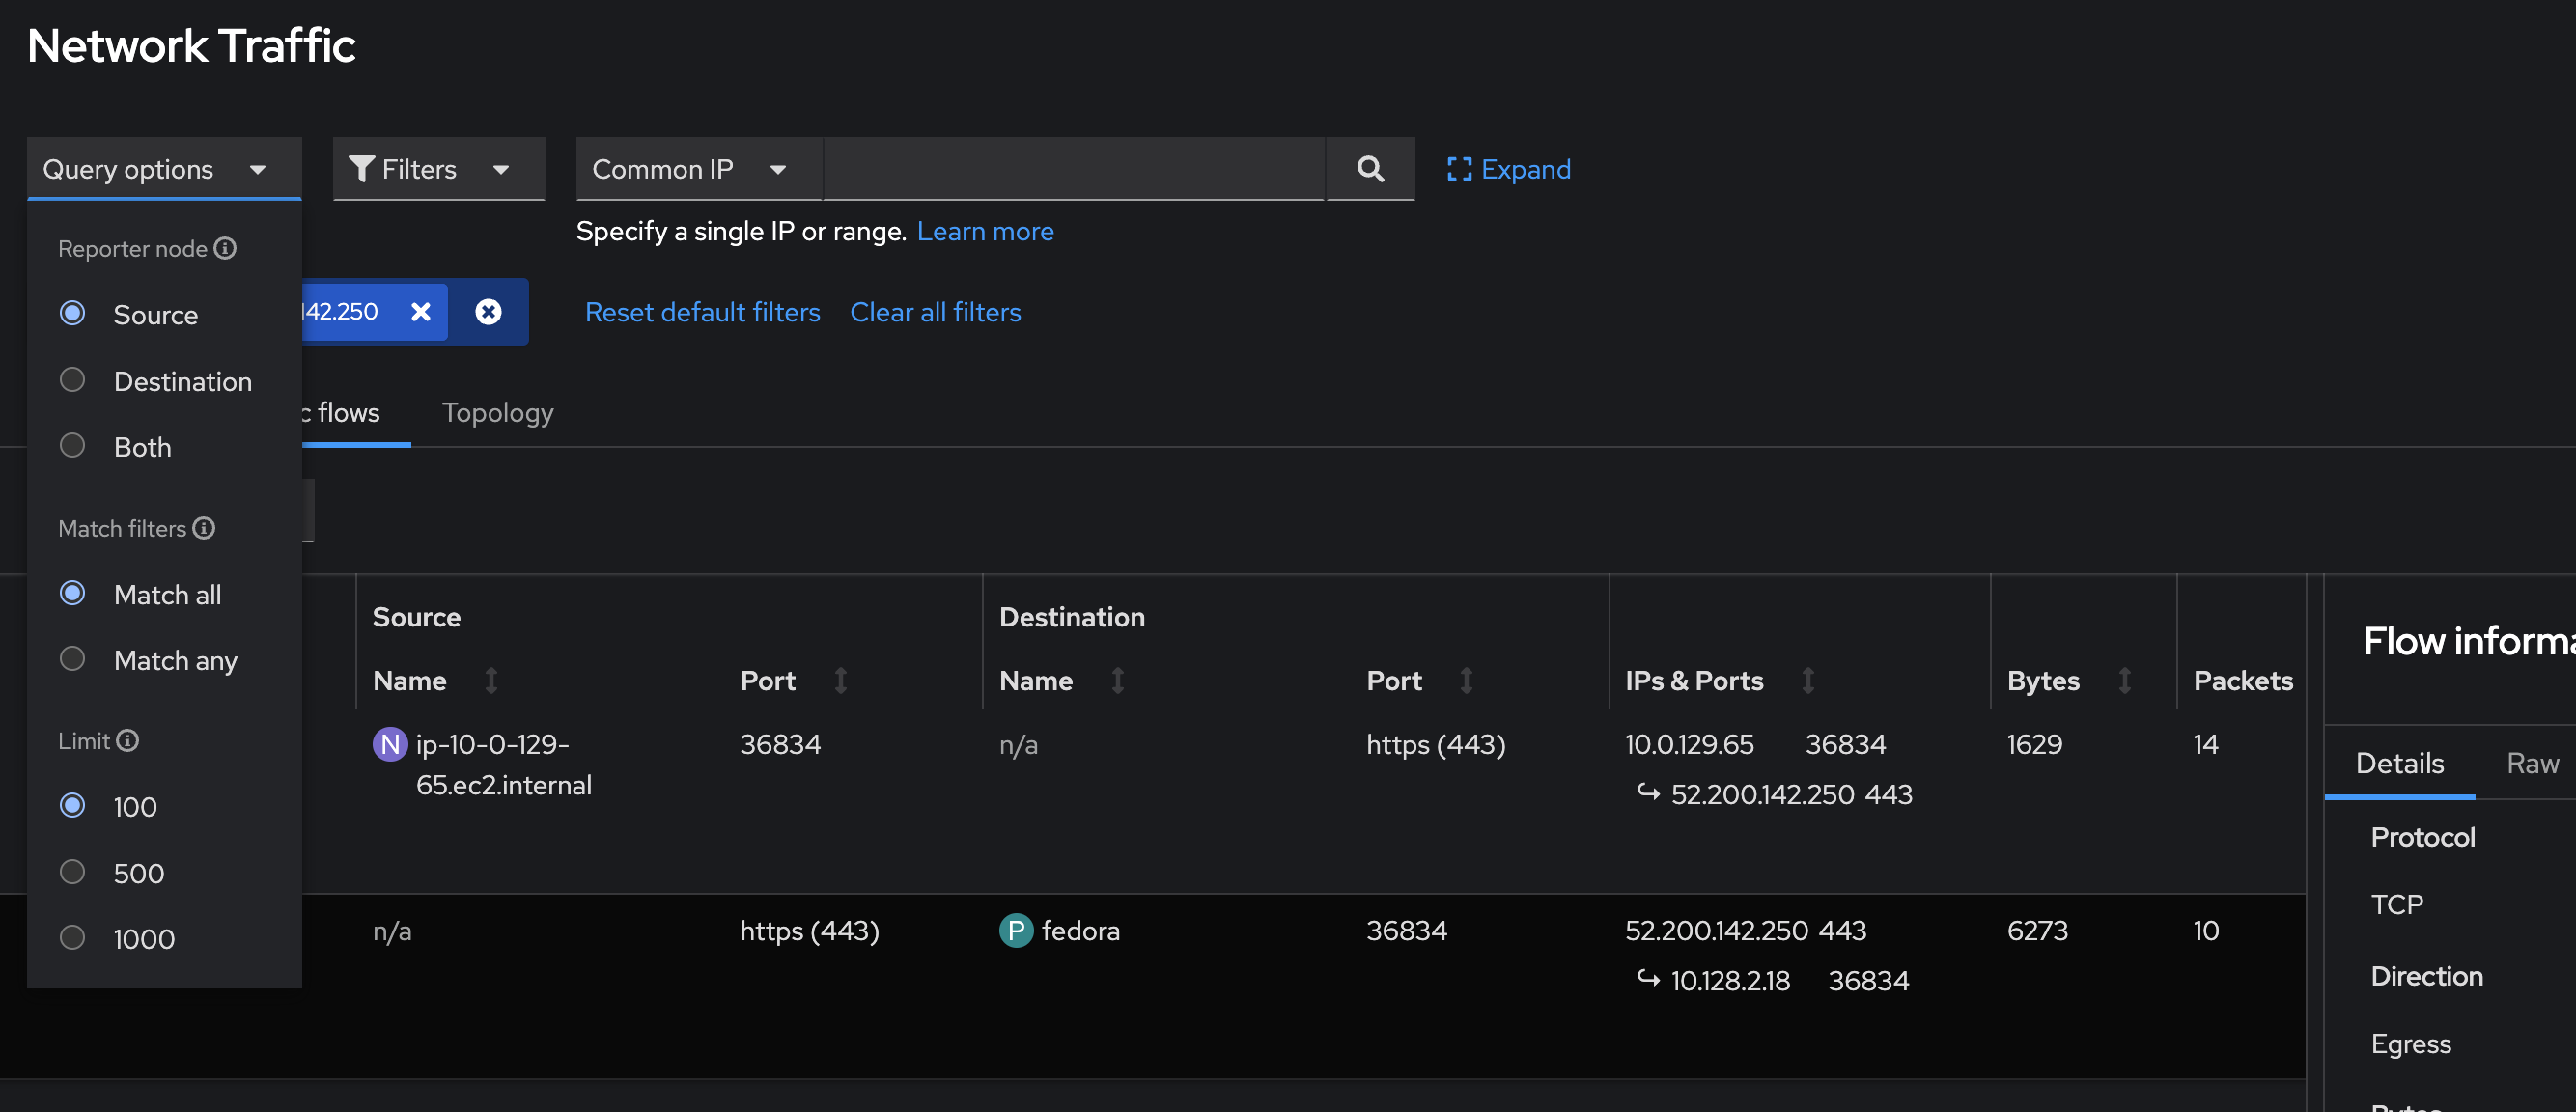
      2. Now in Query Options, select "Source".  Do the same curl request.  This time, it shows only the return traffic from the web site to your pod (see 02-source.png, 1st row).  This means it is the destination node reporting ingress traffic.


      Attachments

        1. 01-dest.png
          01-dest.png
          260 kB
        2. 02-source.png
          02-source.png
          265 kB
        3. image-2022-11-24-14-24-09-176.png
          image-2022-11-24-14-24-09-176.png
          110 kB
        4. image-2022-11-24-14-37-59-244.png
          image-2022-11-24-14-37-59-244.png
          157 kB
        5. image-2022-11-24-14-42-56-069.png
          image-2022-11-24-14-42-56-069.png
          110 kB
        6. image-2022-11-24-14-45-48-160.png
          image-2022-11-24-14-45-48-160.png
          155 kB
        7. image-2022-11-25-11-04-55-169.png
          image-2022-11-25-11-04-55-169.png
          163 kB
        8. Screenshot 2022-11-23 at 12.10.38.png
          Screenshot 2022-11-23 at 12.10.38.png
          244 kB
        9. Screenshot 2022-11-23 at 12.11.13.png
          Screenshot 2022-11-23 at 12.11.13.png
          245 kB

        Activity

          People

            jtakvori Joel Takvorian
            stlee@redhat.com Steven Lee
            Votes:
            0 Vote for this issue
            Watchers:
            6 Start watching this issue

            Dates

              Created:
              Updated:
              Resolved: