Uploaded image for project: 'Network Observability'
  1. Network Observability
  2. NETOBSERV-602

Correctness issues with byte rates

    • False
    • None
    • False
    • NetObserv - Sprint 225, NetObserv - Sprint 226, NetObserv - Sprint 227

      After adding more bytes counter metrics, I'm trying to validate the correctness using different sources :

      • Our Topology view
      • Loki + Grafana
      • These new metrics
      • Existing cluster metrics

      The bad news is, none of them match perfectly, they all differ. But I can see an explanation for the new metrics vs cluster metrics mismatch.


      I'm considering for instance the bytes sent from Loki pod (in a single-pod deployment), reported from destination. Note that I have sampling set to 1.

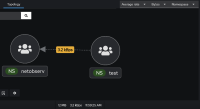
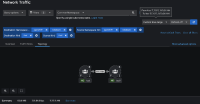
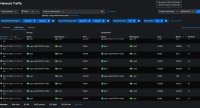
      1. Topology:

      AVG ~= 62 KBps


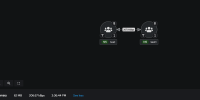
      2. Loki+Grafana:

      AVG ~= 2.4 KBps


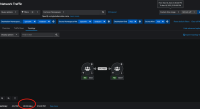
      3. New metrics:

      AVG ~= 15 KBps


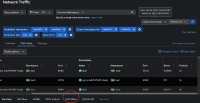
      4. Existing cluster metrics:

      AVG ~= 8 KBps


      1 and 2 are using exactly the same data source: Loki; and the same query language: logQL. I must be missing something, because I think we should get the same results. In any case the byterate displayed in the console plugin seems wrong.

      3 is obtained from the first primary source (ebpf agent), but then via prometheus / promQL.

      4 is, afaik, a container/cadvisor metric.


      My current explanation for 3 vs 4 discrepancy is that there's a known issue with the eBPF agent, as it is monitoring all interfaces (pods and nodes), resulting in duplicated data. Assuming this is the case, dividing by two would give us something coherent with 4.


      Then, I don't explain the result with 2. It is significantly lower than 3, and would be even worse if we divide it by two. Is that Loki / LogQL doing a poor job at extracting timeseries? I hope not, but it should be investigated.

      Same for 1., either I am missing something that I don't capture with my queries, or I'd expect to see similar values as 2. since it's using the same data source.

        1. Capture d’écran du 2022-09-27 10-11-42.png
          145 kB
          Joel Takvorian
        2. Capture d’écran du 2022-09-27 10-12-01.png
          158 kB
          Joel Takvorian
        3. Capture d’écran du 2022-09-27 10-11-04.png
          77 kB
          Joel Takvorian
        4. Capture d’écran du 2022-09-27 10-10-50.png
          23 kB
          Joel Takvorian
        5. Screen Shot 2022-10-27 at 10.14.42 PM.png
          21 kB
          Mehul Modi
        6. Screen Shot 2022-10-27 at 10.14.46 PM.png
          13 kB
          Mehul Modi
        7. Screen Shot 2022-10-27 at 10.15.04 PM.png
          97 kB
          Mehul Modi
        8. Screen Shot 2022-10-27 at 10.15.04 PM-1.png
          97 kB
          Mehul Modi
        9. Screen Shot 2022-10-28 at 12.00.28 PM.png
          205 kB
          Mehul Modi
        10. Screen Shot 2022-10-28 at 11.59.49 AM.png
          119 kB
          Mehul Modi
        11. Screen Shot 2022-10-28 at 11.59.24 AM.png
          23 kB
          Mehul Modi
        12. image-2022-11-16-15-37-49-266.png
          34 kB
          Mehul Modi
        13. image-2022-11-16-15-38-29-511.png
          116 kB
          Mehul Modi
        14. image-2022-11-16-16-06-50-020.png
          107 kB
          Mehul Modi
        15. image-2022-11-16-16-07-21-125.png
          288 kB
          Mehul Modi
        16. image-2022-11-17-11-23-09-443.png
          218 kB
          Mehul Modi
        17. screenshot-1.png
          182 kB
          Mehul Modi

            jtakvori Joel Takvorian
            jtakvori Joel Takvorian
            Mehul Modi Mehul Modi
            Votes:
            0 Vote for this issue
            Watchers:
            4 Start watching this issue

              Created:
              Updated:
              Resolved: