-
Bug
-
Resolution: Done
-
 Major
Major
-
netobserv-1.5-candidate
-
Quality / Stability / Reliability
-
False
-
-
None
-
Important
-
None
-
None
-
NetObserv - Sprint 244, NetObserv - Sprint 245, NetObserv - Sprint 246
-
None
-
None
-
None
Description of problem:
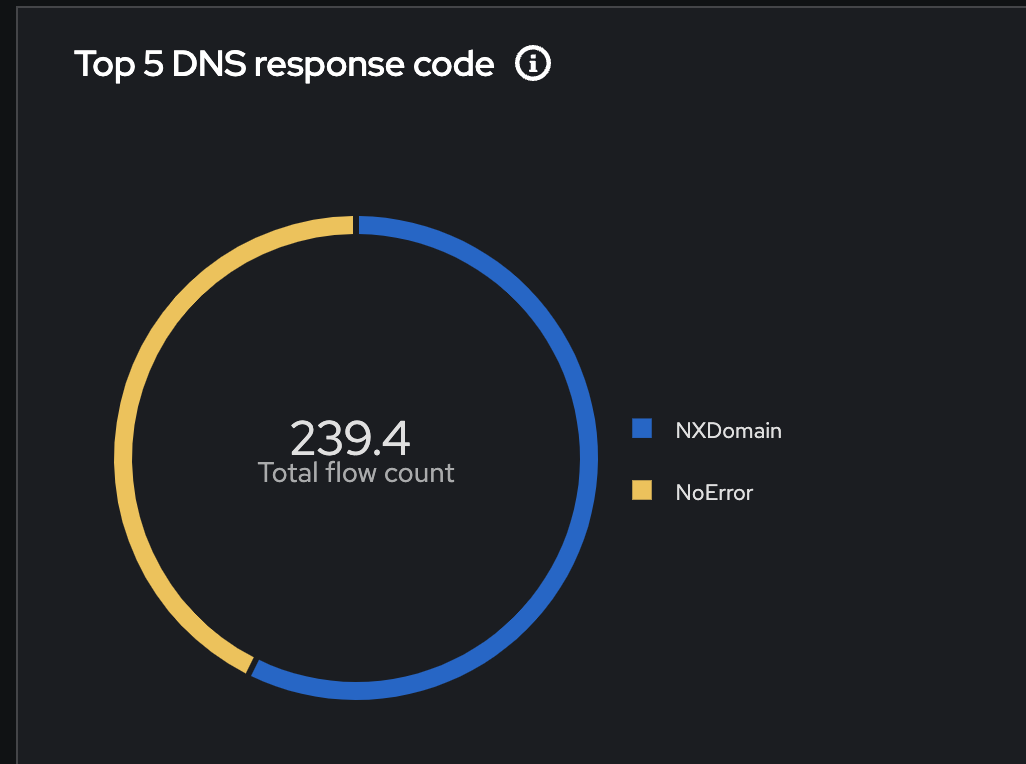
Top X DNS response code graph shows incorrect counters like non-whole numbers or the number of flows between the table view and the panel dont match
Steps to Reproduce:
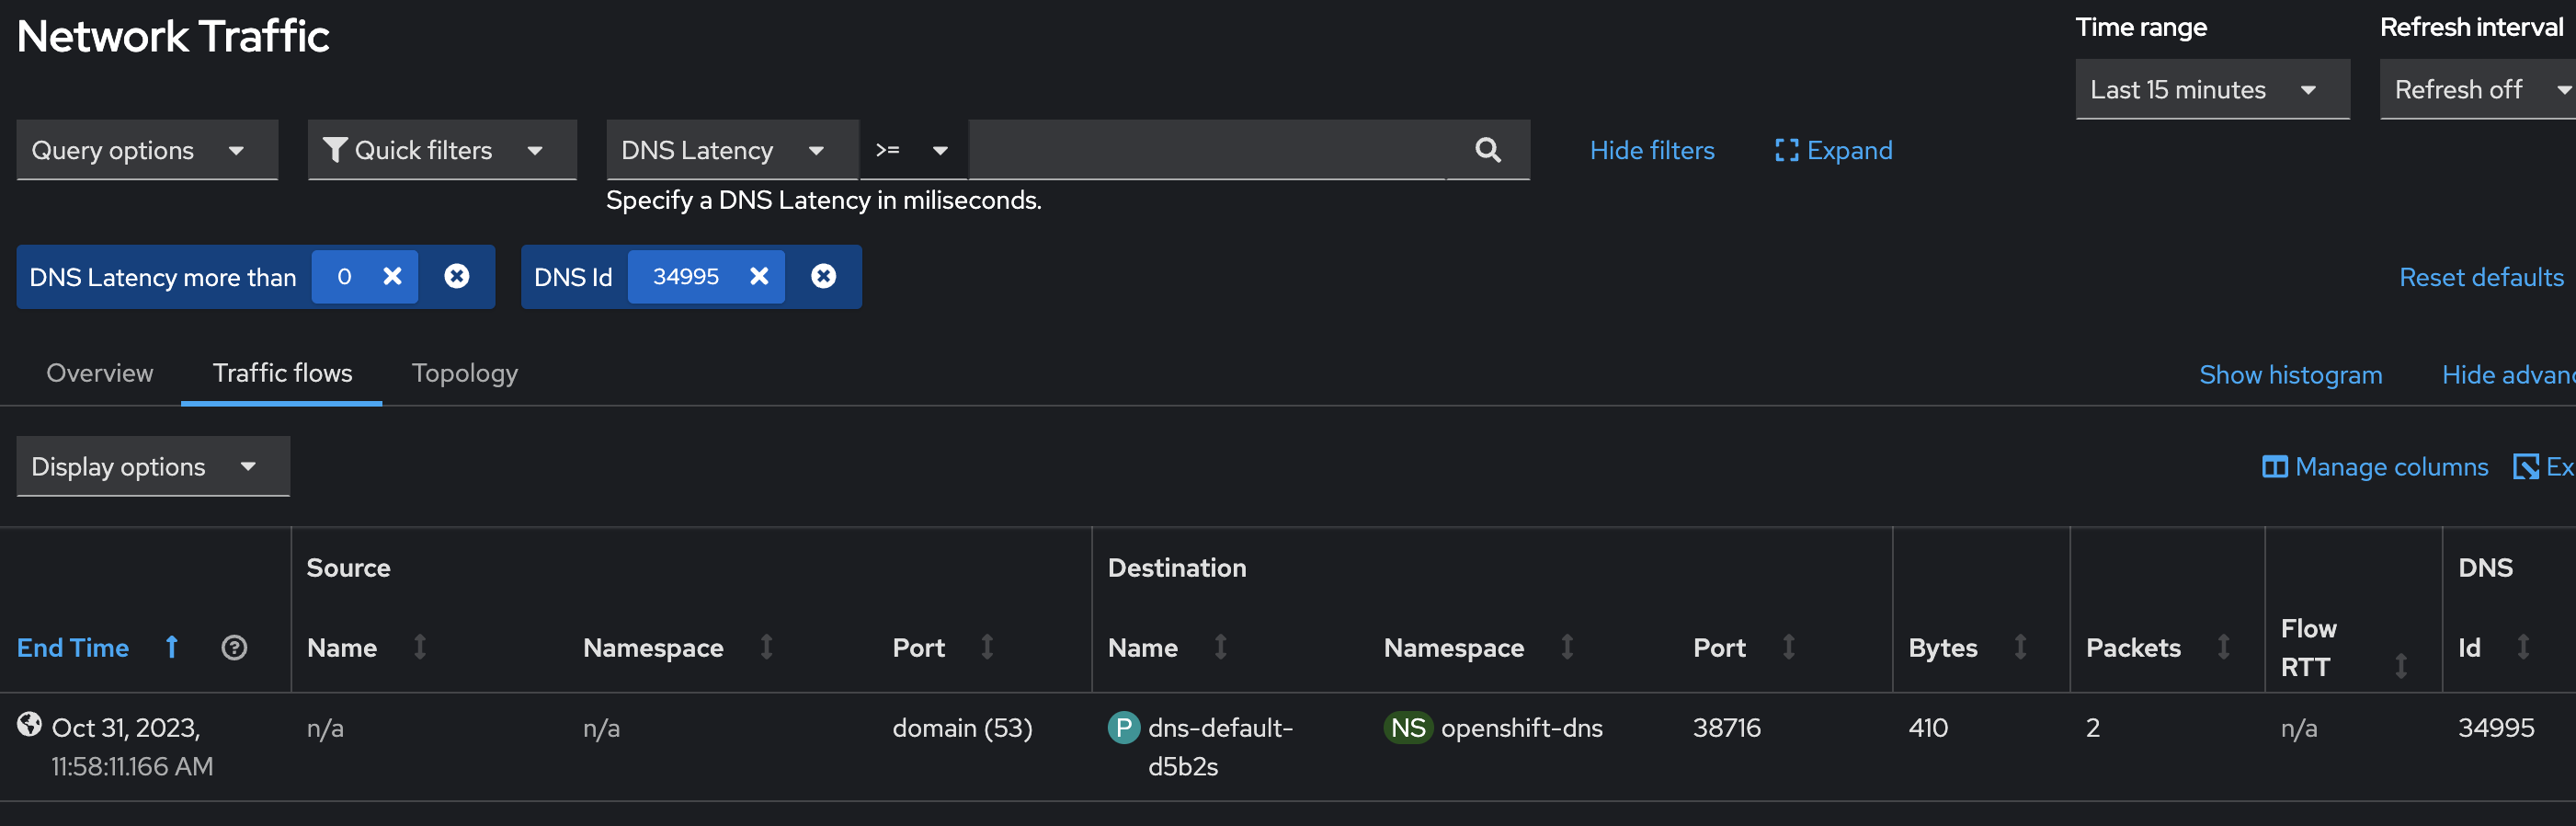
1. Deploy NetObserv and flowcollector with DNSTracking feature enabled
2. Go to table view and filter on DNSLatencies > 0
3. Search for a flow which has DNSLatency value at least 1ms and filter on that flow's DNS Id
4. Now shift to overview tab with the same filters, the number of filters in table should match the value seen in Top X DNS response code panel.
5. Remove the filters and the panel shows non-whole number values
Actual results:
Actual results are written in steps 4 and 5 above
Expected results:
Panel should have whole number values and the number should match seen in table view