-
Sub-task
-
Resolution: Done
-
 Normal
-
None
-
Quality / Stability / Reliability
-
False
-
-
False
-
-
Overview
This feature introduces native alerting capabilities to the Migration Toolkit for Virtualization (MTV) by integrating with the OpenShift/Prometheus monitoring stack. It allows administrators to receive proactive notifications when migration plans fail or encounter critical issues, rather than requiring manual monitoring of the MTV dashboard.
Technical Details for Documentation
1. Core Functionality
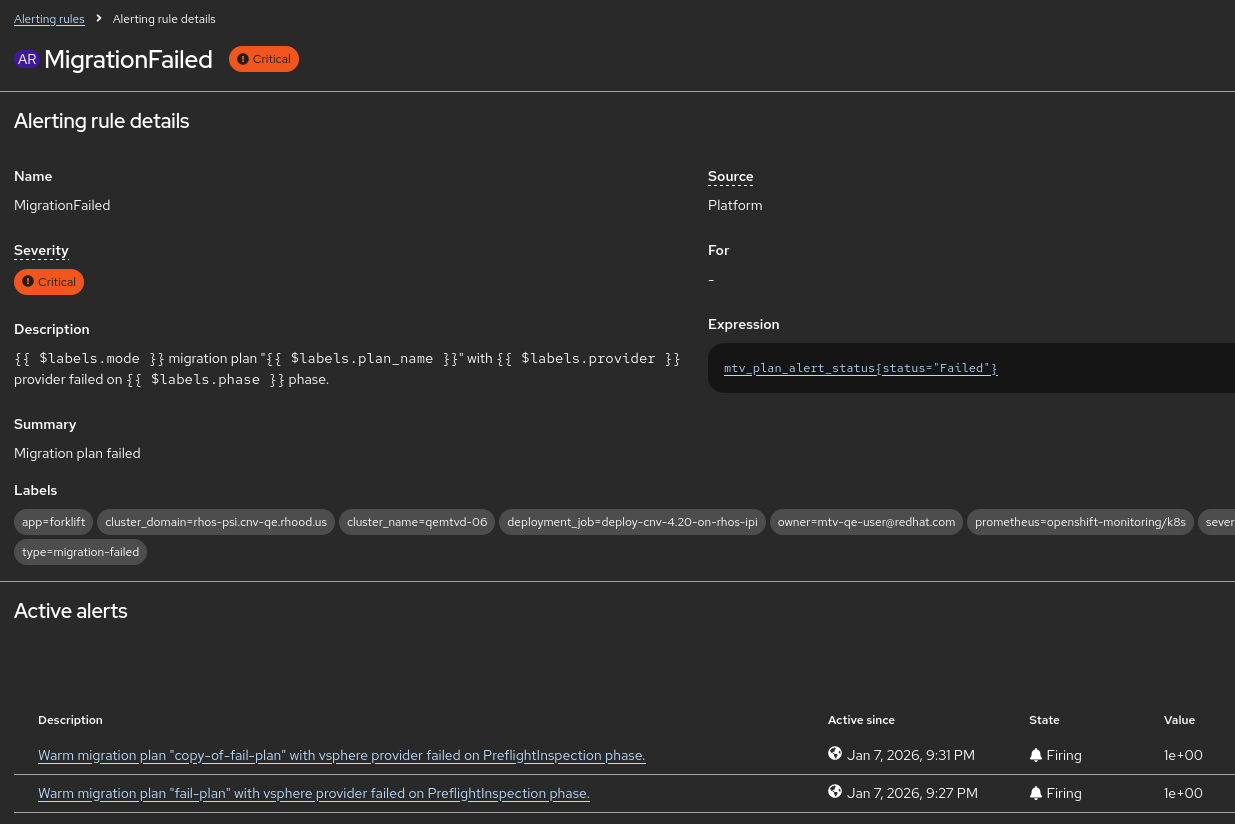
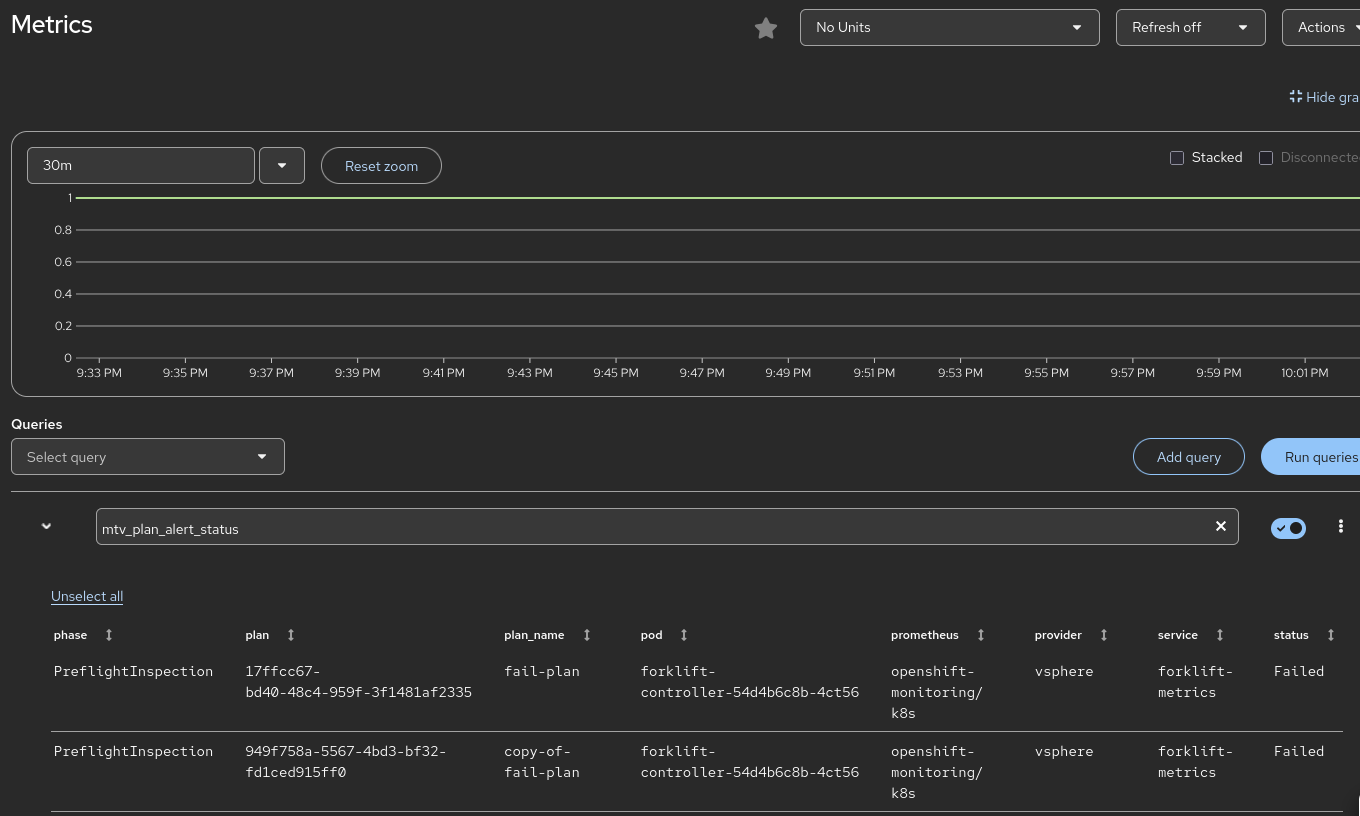
MTV now exports specific metrics that trigger Prometheus alerts. The primary goal is to notify users of Migration Plan Failures.
- Metric Name: forklift_plan_status (or similar, as defined in plan_metrics.go).
- Alert Logic: The system monitors the status of migration plans. If a plan enters a Failed state, an alert is fired.
- Metric Cleanup: The implementation includes logic to "clean up" metrics. When a plan status changes or a plan is deleted, deprecated time-series data is zeroed out to prevent "stale" alerts (false positives).
2. Integrated Alerts
The following alerts are introduced (verify exact naming in the final CRD/YAML templates in the PR):
- MTVPlanFailed: Triggered when a migration plan fails to complete.
- Severity: Critical/Warning (depending on the environment configuration).
- Details captured: The alert includes labels for the plan_name, namespace, and potentially the provider type to help the admin identify the failure source immediately.
3. User Workflow & Configuration
Technical writers should include instructions on how to view and manage these alerts:
- Viewing Alerts: Alerts appear in the OpenShift Container Platform (OCP) Console under Observe > Alerting.
- Notification Channels: Because these are standard Prometheus alerts, users can configure Alertmanager to send these notifications via:
-
- Slack
-
- PagerDuty
-
- Webhooks
4. Prerequisites
- The Monitoring stack must be enabled in the OpenShift cluster.
- The forklift-controller must be running with the monitoring service enabled (usually default in recent MTV versions).
5. Troubleshooting for Users
If a user is not seeing alerts:
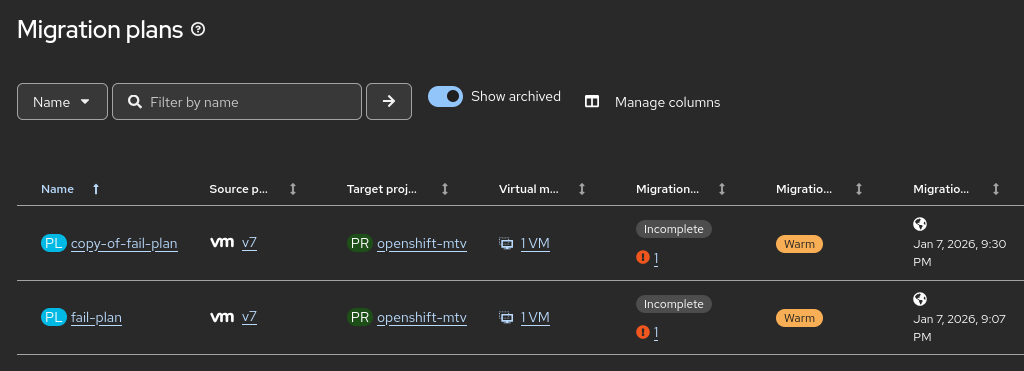
- Verify that the Migration Plan has indeed reached a Failed status in the MTV UI.
- Check the forklift-controller logs for any errors related to metric reconciliation.
- Ensure the ServiceMonitor for Forklift is active in the openshift-mtv namespace.
Action Items for MTV-4262 (Doc Ticket)
- New Section: Create a "Monitoring and Alerting" section in the Managing Migrations guide.
- Alert Reference Table: List the new Prometheus alerts, their descriptions, and recommended remedial actions (e.g., "Check the migration logs for disk conversion errors").
- Clean-up Note: Mention that metrics are reconciled dynamically; once a failed plan is deleted or restarted and succeeds, the alert will resolve automatically.
To help the technical writer tailor the documentation for MTV-4262, here is the refined JTBD statement and professional personas.
Jobs-to-be-Done (JTBD) Statement
"When I am executing a large-scale virtualization migration, I want to receive automated notifications through my existing monitoring stack if a migration plan fails, so that I can minimize downtime and address errors immediately without manually monitoring the MTV interface."
User Personas
1. Infrastructure Administrator
- Core Responsibility: Maintains the health of the OpenShift cluster and oversees the migration tools.
- Focus: Centralized monitoring and "single pane of glass" operations.
- Usage of Feature: Integrates MTV alerts into the standard OpenShift Alertmanager configuration. They rely on these alerts to know when the Migration Toolkit requires manual intervention (e.g., storage is full or a source provider is unreachable) without having to stay logged into the MTV console.
2. Migration Engineer
- Core Responsibility: Configuring migration plans, mapping resources, and executing the move of production workloads.
- Focus: Completion rates and troubleshooting.
- Usage of Feature: Uses the specific alert labels (such as plan_name and namespace) provided in the Prometheus notification to quickly identify which specific migration failed. This allows them to jump directly to the relevant logs to remediate the issue.
3. Site Reliability Engineer (SRE)
- Core Responsibility: System availability, automation, and observability.
- Focus: Scaling and automated incident response.
- Usage of Feature: Consumes the raw metrics (e.g., forklift_plan_status) to build custom Grafana dashboards that track migration success rates over time. They may also use these alerts to trigger automated "clean-up" scripts or internal ticketing workflows.
Guidance for the Technical Writer
The documentation should bridge the gap between the Infrastructure Administrator (who sets up the alerting rules) and the Migration Engineer (who acts on them).
Key documentation sections to include:
- Configuring Alert Routing: How to ensure MTVPlanFailed alerts reach the correct team via Slack, Email, or PagerDuty.
- Alert Definitions: A list of the new alerts (e.g., MTVPlanFailed) and what each specific severity level indicates.
- Metric Reference: A description of the Prometheus metrics being exported so the SRE can build custom visualizations.
- is duplicated by
-
MTV-2764 [DOC] Enhanced Alerts for MTV and Migration Plans in OpenShift Virtualization
-

- Closed
-