-
Bug
-
Resolution: Done
-
 Major
Major
-
Logging 5.2
-
False
-
False
-
NEW
-
NEW
-
-
Logging (LogExp) - Sprint 206
Description of problem:
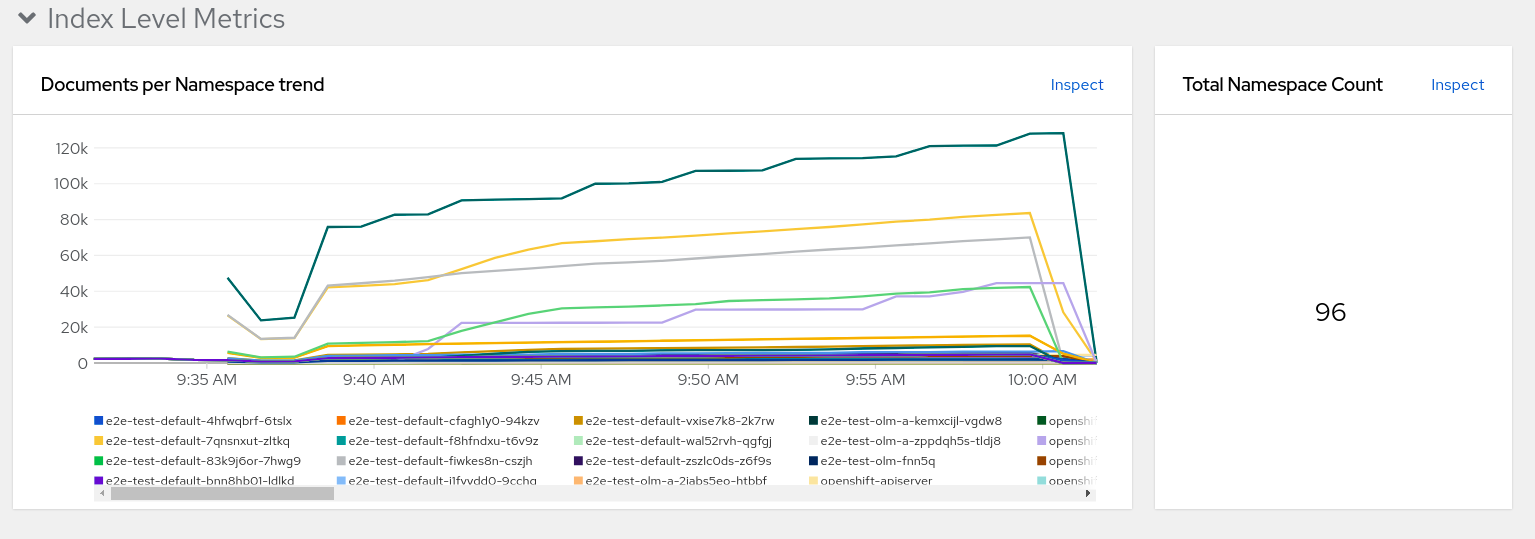
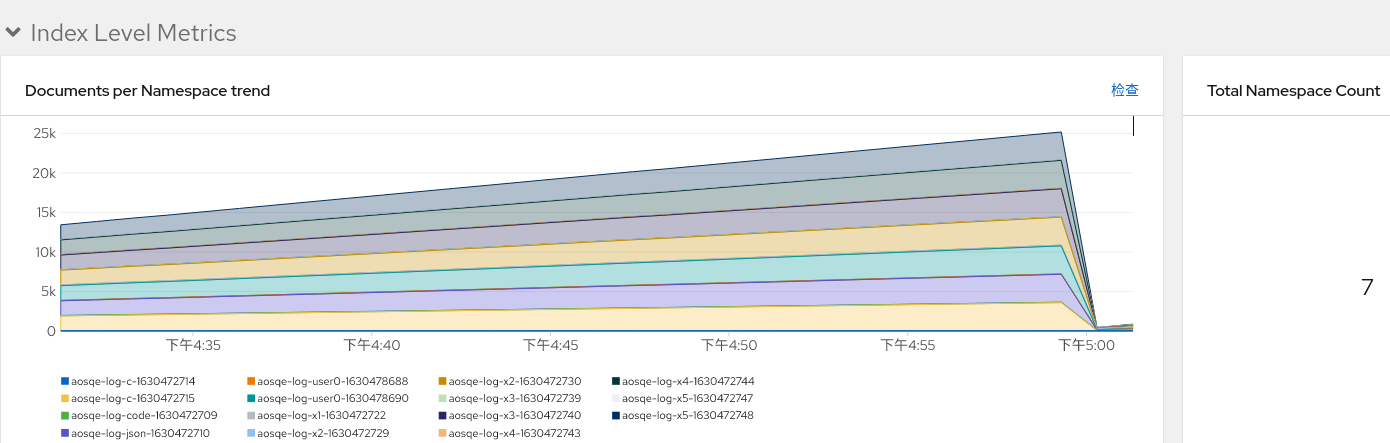
The value of card `Total Namespace Count` in Logging/Elasticsearch dashboard equals to $es_data_node_count * es_index_namespaces_total, which I think it's not correct.
For example, in a cluster there are 3 ES pods, the value of metric `es_index_namespaces_total` is 32, but the value of `Total Namespace Count` is 96:
$ curl -k -H "Authorization: Bearer `oc sa get-token prometheus-k8s -n openshift-monitoring`"   -H "Content-type: application/json" https://prometheus-k8s-openshift-monitoring.apps.xxxx.com/api/v1/query?query=es_index_namespaces_total |jq
  % Total    % Received % Xferd  Average Speed   Time    Time     Time  Current
                                 Dload  Upload   Total   Spent    Left  Speed
100  1068    0  1068    0     0   1399      0 --:--:-- --:--:-- --:--:--  1397
{
  "status": "success",
  "data": {
    "resultType": "vector",
    "result": [
      {
        "metric": {
          "__name__": "es_index_namespaces_total",
          "cluster": "elasticsearch",
          "container": "proxy",
          "endpoint": "elasticsearch",
          "instance": "10.128.2.23:60001",
          "job": "elasticsearch-metrics",
          "namespace": "openshift-logging",
          "pod": "elasticsearch-cdm-gfepvhgn-2-f567669f7-6wtwt",
          "service": "elasticsearch-metrics"
        },
        "value": [
          1630375284.642,
          "32"
        ]
      },
      {
        "metric": {
          "__name__": "es_index_namespaces_total",
          "cluster": "elasticsearch",
          "container": "proxy",
          "endpoint": "elasticsearch",
          "instance": "10.129.2.33:60001",
          "job": "elasticsearch-metrics",
          "namespace": "openshift-logging",
          "pod": "elasticsearch-cdm-gfepvhgn-3-554dd4dd88-rp92g",
          "service": "elasticsearch-metrics"
        },
        "value": [
          1630375284.642,
          "32"
        ]
      },
      {
        "metric": {
          "__name__": "es_index_namespaces_total",
          "cluster": "elasticsearch",
          "container": "proxy",
          "endpoint": "elasticsearch",
          "instance": "10.131.0.71:60001",
          "job": "elasticsearch-metrics",
          "namespace": "openshift-logging",
          "pod": "elasticsearch-cdm-gfepvhgn-1-c5966bf74-kphn2",
          "service": "elasticsearch-metrics"
        },
        "value": [
          1630375284.642,
          "32"
        ]
      }
    ]
  }
}
However in my cluster, the ns count is 78:
$ oc get ns |grep -v "NAME" |wc -l
78
Version-Release number of selected component (if applicable):
The EO and ES6 images are built with latest code from master branch.
How reproducible:
Always
Steps to Reproduce:
1. deploy logging
2. log in to OCP console, check Logging/Elasticsearch dashboard
3.
Actual results:
Expected results:
Additional info:
- blocks
-
LOG-1680 Introduce namespace metrics into OCP dashboards
-
- Closed
-
- links to