-
Feature
-
Resolution: Done
-
Critical
-
None
-
-
Todo
-
Fuse On Openshift
Epic Brief - https://docs.google.com/document/d/11Pub9n3QFK0VktBNlu48aC2ilX4P7fNyluVh3kjL2mc/edit#
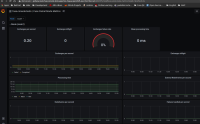
We should provide some default Grafana dashboards for Fuse using the camel metrics we measure, and give steps for an easy way to install them and possibly the grafana-operator as well if needed.
In Scope:
- Exemplary grafana dashboards
- Pointers to upstream documentation how to import dashboards into Grafana
Out of scope:
- Instructions on how to install Grafana
- A Grafana operator or anything like that
- causes
-
ENTESB-15288 [Fuse Console] Prometheus metrics are not exposed
-
- Closed
-
- is related to
-
ENTESB-14027 Prometheus exporter for standalone Fuse 7 on Karaf
-
- Closed
-
- relates to
-
ENTESB-9739 Create Grafana dashboard for Fuse
-
- Closed
-
There are no Sub-Tasks for this issue.
