-
Bug
-
Resolution: Not a Bug
-
Blocker
-
None
-
fuse-7.8-GA
-
None
-
False
-
False
-
Undefined
-
Fuse On Openshift
-
-
I was verifying ENTESB-13781 following the instruction from this doc.
I deployed Fuse Console from operator on OpenShift 4.5
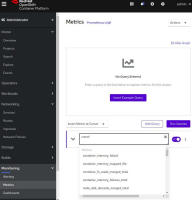
Using OpenShift UI interface, I navigated to Monitoring -> Metrics and I wasn't able to view Prometheus metrics exposed.
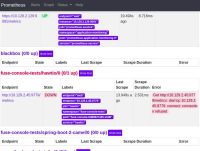
I opened Prometheus UI interface separately (using provided URL) and in targets I found out that Fuse Console has a state as Down and has the following error:
Get http://10.129.2.45:9779/metrics: dial tcp 10.129.2.45:9779: connect: connection refused
With help of mmuzikar we deployed application-monitoring-operator with running prometheus and grafana, we labeled the namespace where Fuse Console is running and still it didn't help.
We suspect that Fuse Console serves its metrics on HTTPS when Prometheus is configured to use HTTP
- is caused by
-
ENTESB-13781 Default Grafana dashboards for Fuse on Openshift and Fuse Standalone
-
- Closed
-

