-
Bug
-
Resolution: Done
-
Normal
-
0.4.0
-
None
-
Quality / Stability / Reliability
-
False
-
-
None
-
None
-
None
-
None
-
None
-
In Progress
-
Bug Fix
-
Version of components:
cluster-observability-operator.0.4.0
OCP version 4.16.0-0.nightly-2024-09-02-173242
Google Chrome Version 128.0.6613.86 (Official Build) (arm64) on Mac M2
Description of the issue:
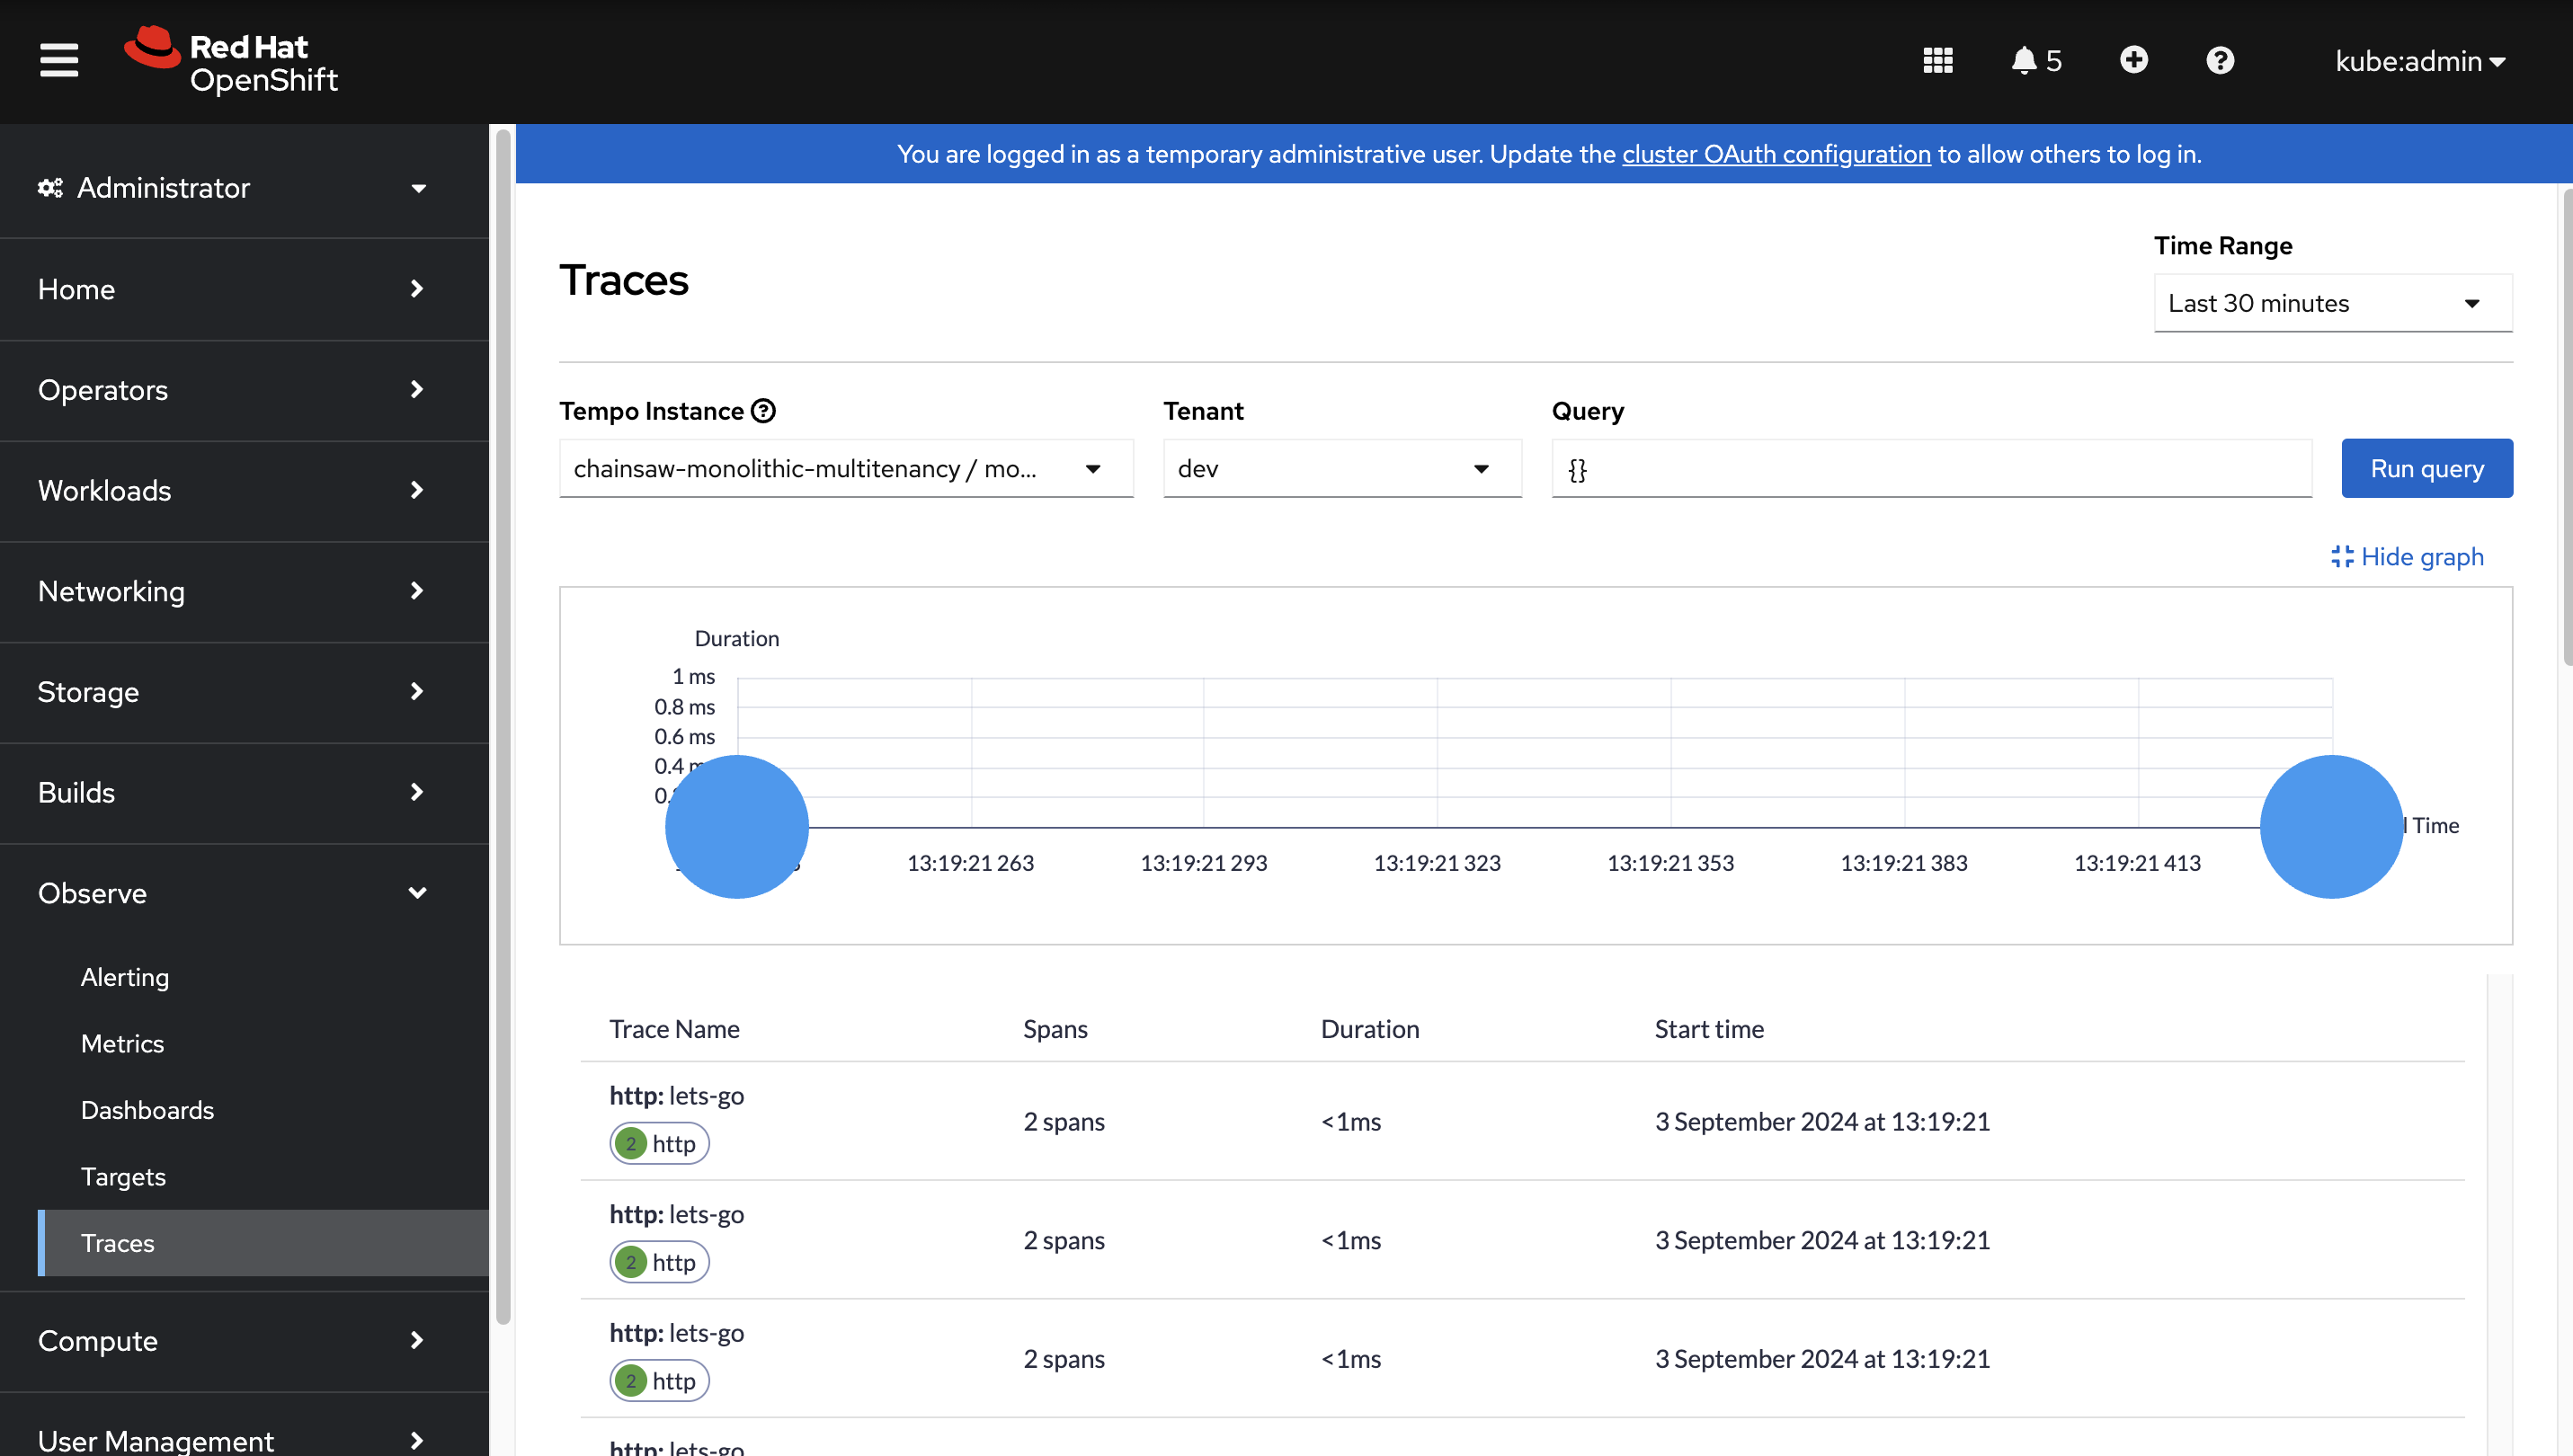
When we view a Tempo instance from the Distributed Tracing UI plugin, the scatter plot graph showing the traces duration is not rendered correctly. The bubble size is too large and overlaps the x and y axis.

Steps to reproduce the issue:
*Install the COO 0.4.0 operator.
*Create the Tracing UI plugin instance with the following CR.
apiVersion: observability.openshift.io/v1alpha1
kind: UIPlugin
metadata:
  name: distributed-tracing
  namespace: openshift-operators
spec:
  type: DistributedTracing
*Deploy a TempoStack instance with multiteanancy enabled, generate and send traces to the instance.
git clone git@github.com:openshift/distributed-tracing-qe.git
go install github.com/kyverno/chainsaw@latest
cd distributed-tracing-qe
chainsaw test --skip-delete tests/e2e-acceptance/multitenancy
or
Create the resource file skipping the assert ones one by one following the file index.
*Check the TempoStack instance from the Tracing UI. The bubble size on the scatter plot graph will be large and overlapping the axis.
- depends on
-
OU-538 Upgrade Perses to v0.48.0
-
- Closed
-
- links to
