Uploaded image for project: 'AeroGear'
  1. AeroGear
  2. AEROGEAR-9773

Daily percentage uptime does not show correct value

XMLWordPrintable

    • Icon: Bug Bug
    • Resolution: Done
    • Icon: Major Major
    • 3.0.0
    • 3.0.0
    • None
    • OSD

    • ER1

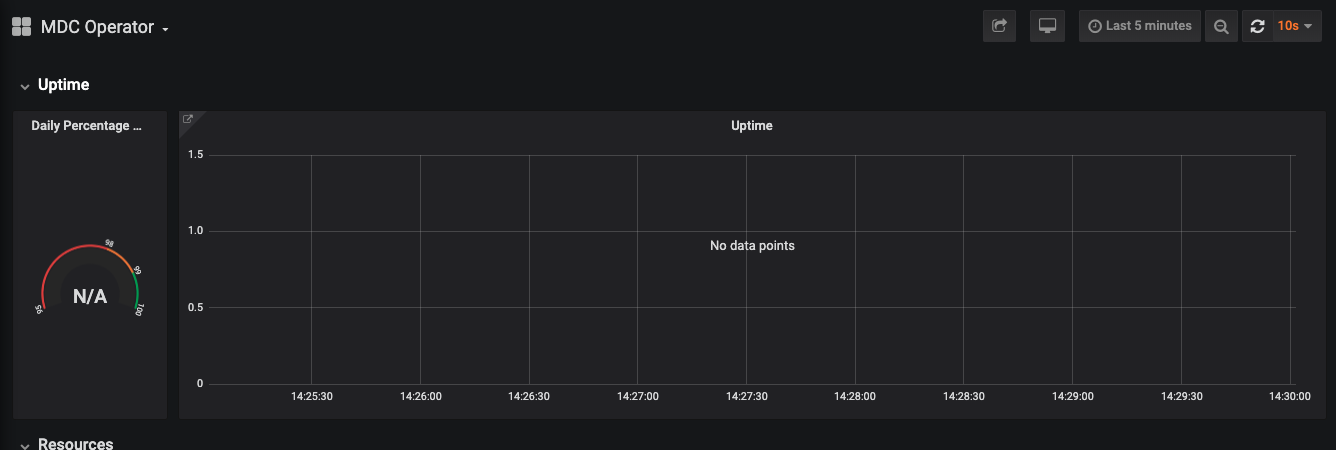
      When reverifying AEROGEAR-9640, found out that when MDC operator is down, in grafana dashboard, there are no data points for uptime when the operator is down. If I select last 5min and wait >5min, Daily percentage uptime is `N/A`.

            rhn-support-cmacedo Camila Macedo (Inactive)
            jhellar@redhat.com Jan Hellar (Inactive)
            Votes:
            0 Vote for this issue
            Watchers:
            2 Start watching this issue

              Created:
              Updated:
              Resolved: