Uploaded image for project: 'AeroGear'
  1. AeroGear
  2. AEROGEAR-9640

Daily Percentage Uptime is relative to selected period and does not represent the entire day

XMLWordPrintable

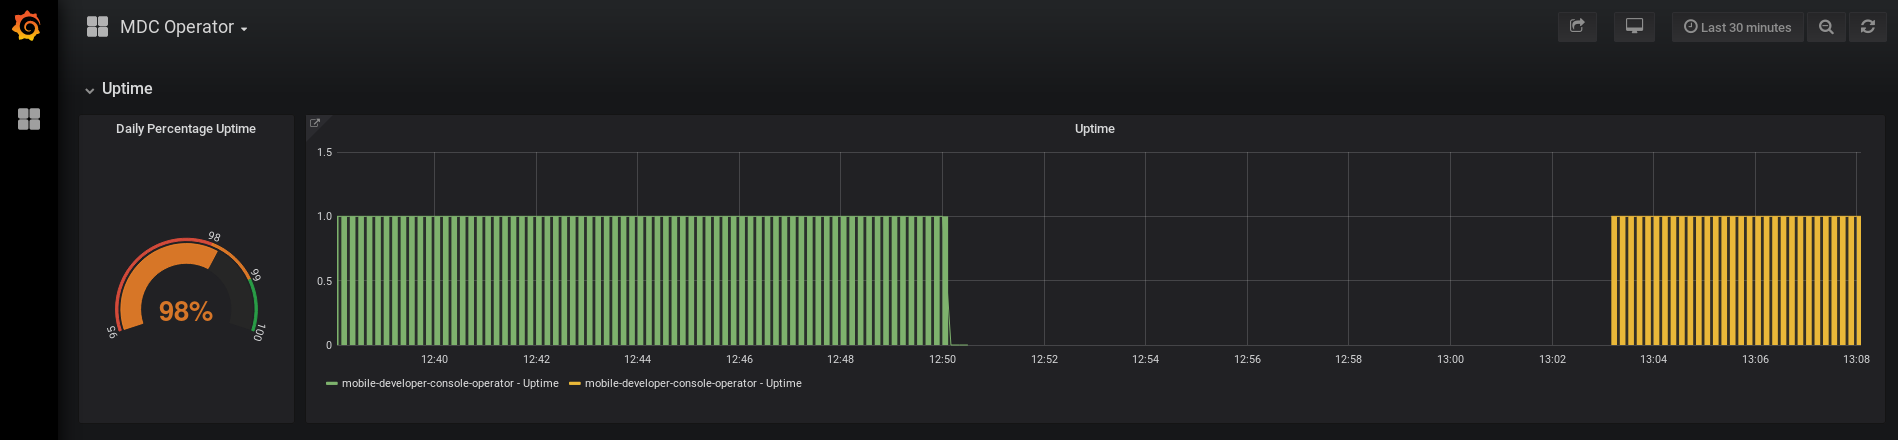
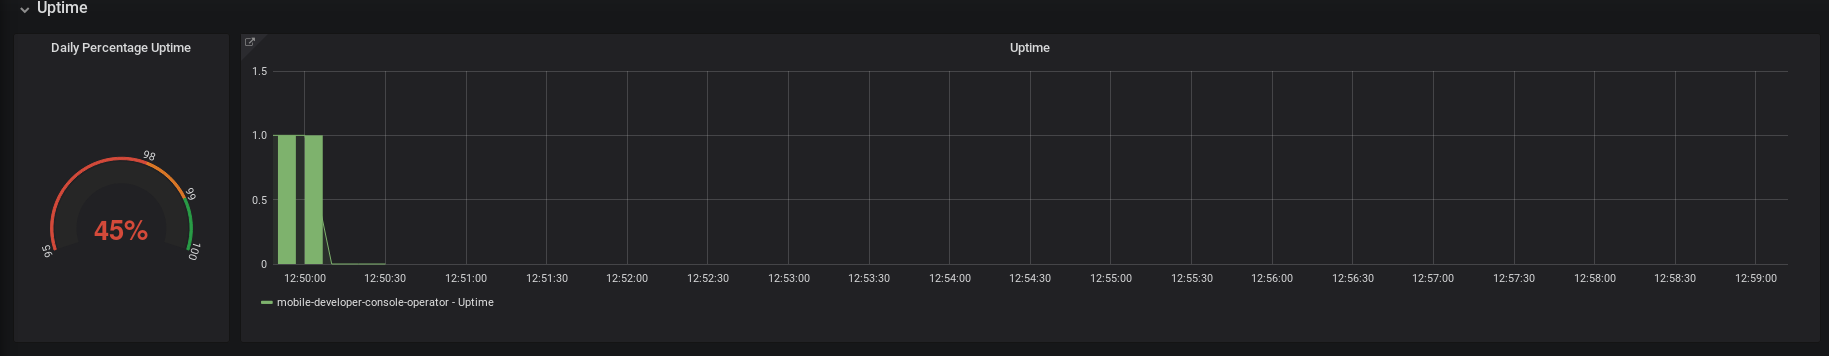
      The Daily Percentage Uptime in MDC Operator Grafana dashboard is relative to the selected period in the dashboard like in the screenshots:


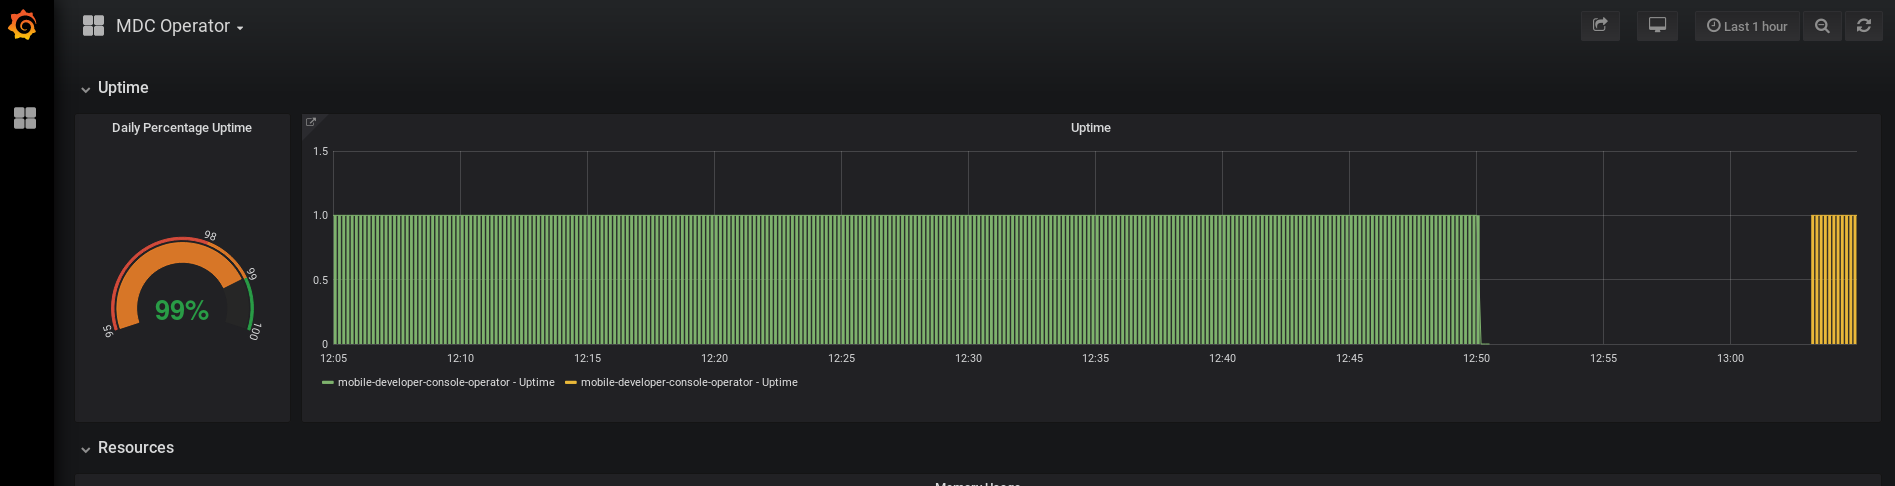
      Don't know which is the expected behavior here but for me, if I read "Daily Percentage Uptime" I expect that the Graph is relative to current day (it's possible to achieve this by setting a custom period only for this graph) otherwise I think that the graph should be just called "Percentage Uptime"

        1. image-2019-07-29-13-07-44-354.png
          55 kB
          Davide Bizzarri
        2. image-2019-07-29-13-08-59-749.png
          52 kB
          Davide Bizzarri
        3. screenshot-1.png
          34 kB
          Davide Bizzarri

            rhn-support-cmacedo Camila Macedo (Inactive)
            dbizzarr@redhat.com Davide Bizzarri (Inactive)
            Votes:
            0 Vote for this issue
            Watchers:
            5 Start watching this issue

              Created:
              Updated:
              Resolved: