-
Bug
-
Resolution: Done
-
 Normal
-
ACM 2.9.0
-
2
-
False
-
-
False
-
-
-
SF Train-19
-
Moderate
-
+
-
None
Description of problem:
If a one or more managed clusters, has a label starting with a digit, clusterlifecycle-state-metrics produces an output which is invalid according to the Prometheus exposition format. This results in Prometheus being unable to correctly scrape the target. This is because label names in Prometheus are not allowed to start with a digit (see the label name regex on that doc page).
This can cause problems down the line for Observability, as the Grafana dashboards depends on the `acm_managed_cluster_labels` being present.
Version-Release number of selected component (if applicable):
ACM 2.9 (customer version), ACM 2.11 (I've tested on this version) - I assume all ACM version are probably affected.
How reproducible:
Always
Steps to Reproduce:
- Add a label to a managed cluster that starts with a digit for example as below where a label `5g-test` is added:
❯ oc get managedcluster local-cluster -o yaml
apiVersion: cluster.open-cluster-management.io/v1
kind: ManagedCluster
metadata:
....
  generation: 4
  labels:
    5g-test: "true"
    cloud: Amazon
......
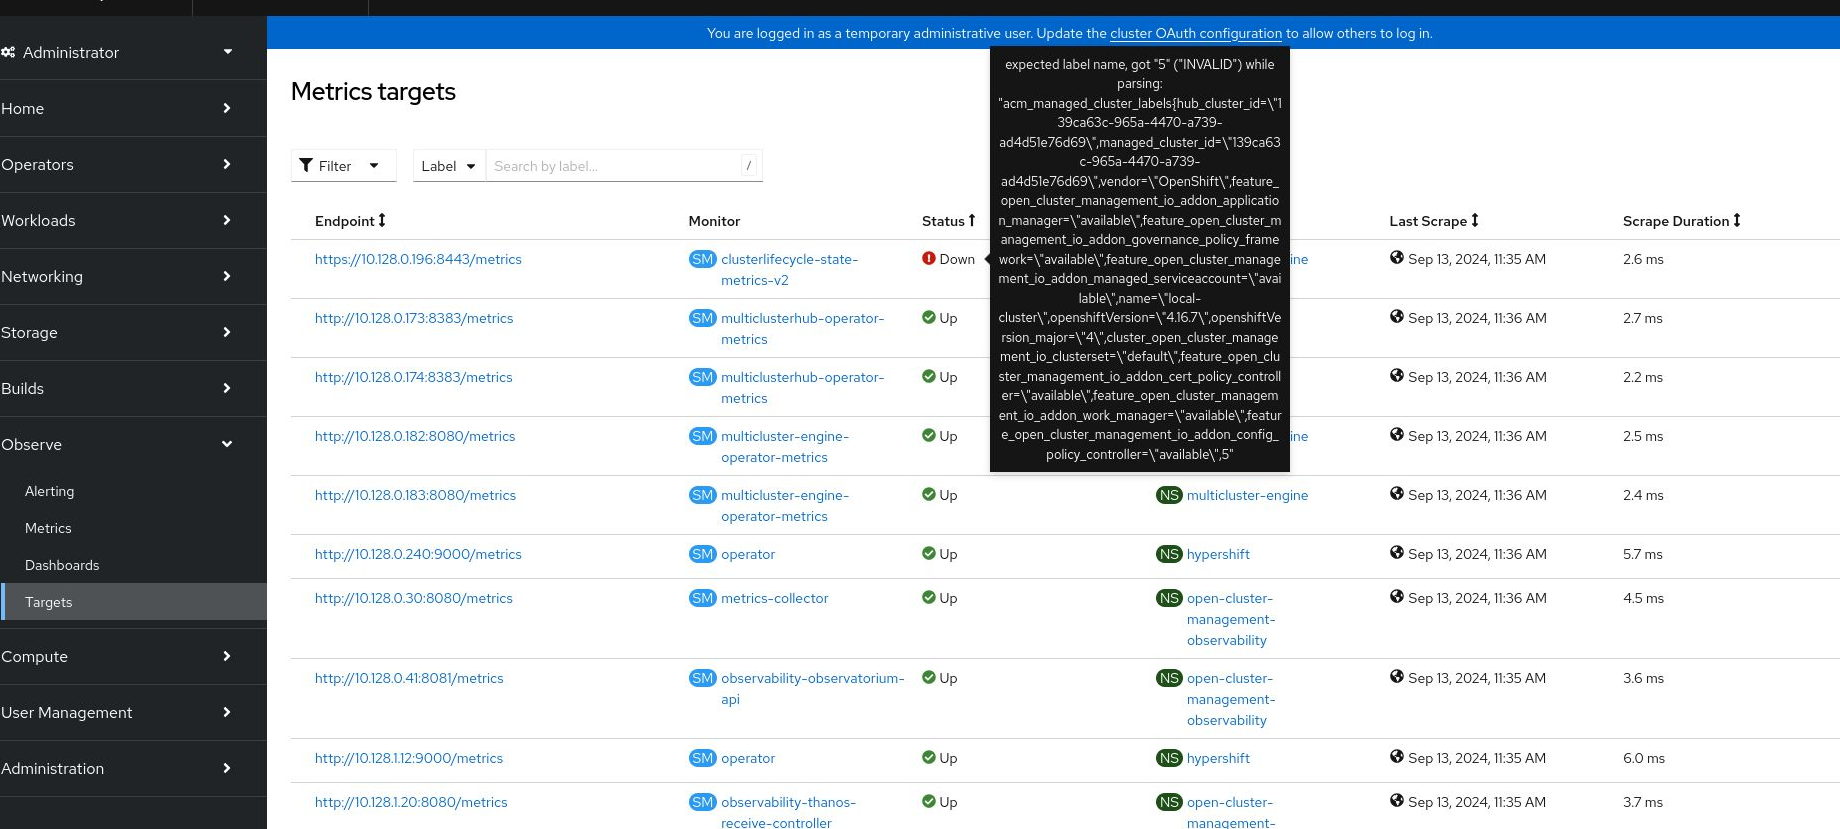
- Now, on the hub go to the OpenShift console "Observe" -> "Targets" and notice that the clusterlifecycle-state-metrics-v2 is down
- See the screenshot for the error to be displayed
Actual results:
Prometheus is unable to scrape the clusterlifecycle-state-metrics target, causing the Observability Grafana dashboards to be completely empty, as they depend on a metric from this component.
Expected results:
- Ideally: the label is renamed or completely omitted from the clusterlifecycle-state-metrics-v2 output, so that no disruption are caused later down the line. A warning message should be present in the clusterlifecycle-state-metrics-v2 logs, so that it's easy figure out why an expected label might be missing or has been renamed.
- Alternatively: either make the pod fail completely when the output is invalid (perhaps a health check could validate that output is valid using promtool or similar), alternatively at least there should be some error message in the pods log so it's possible to understand what is going on.
Additional info:
Example use of promtool:
❯ oc exec -it -n openshift-monitoring prometheus-k8s-0 -c prometheus -- /bin/bash

bash-5.1$ curl -s -k https://clusterlifecycle-state-metrics-v2.multicluster-engine.svc.cluster.local:8443/metrics | promtool check metrics
- causes
-
-
- Closed
-