-
Feature
-
Resolution: Unresolved
-
Major
-
None
-
False
-
False
-
0% To Do, 0% In Progress, 100% Done
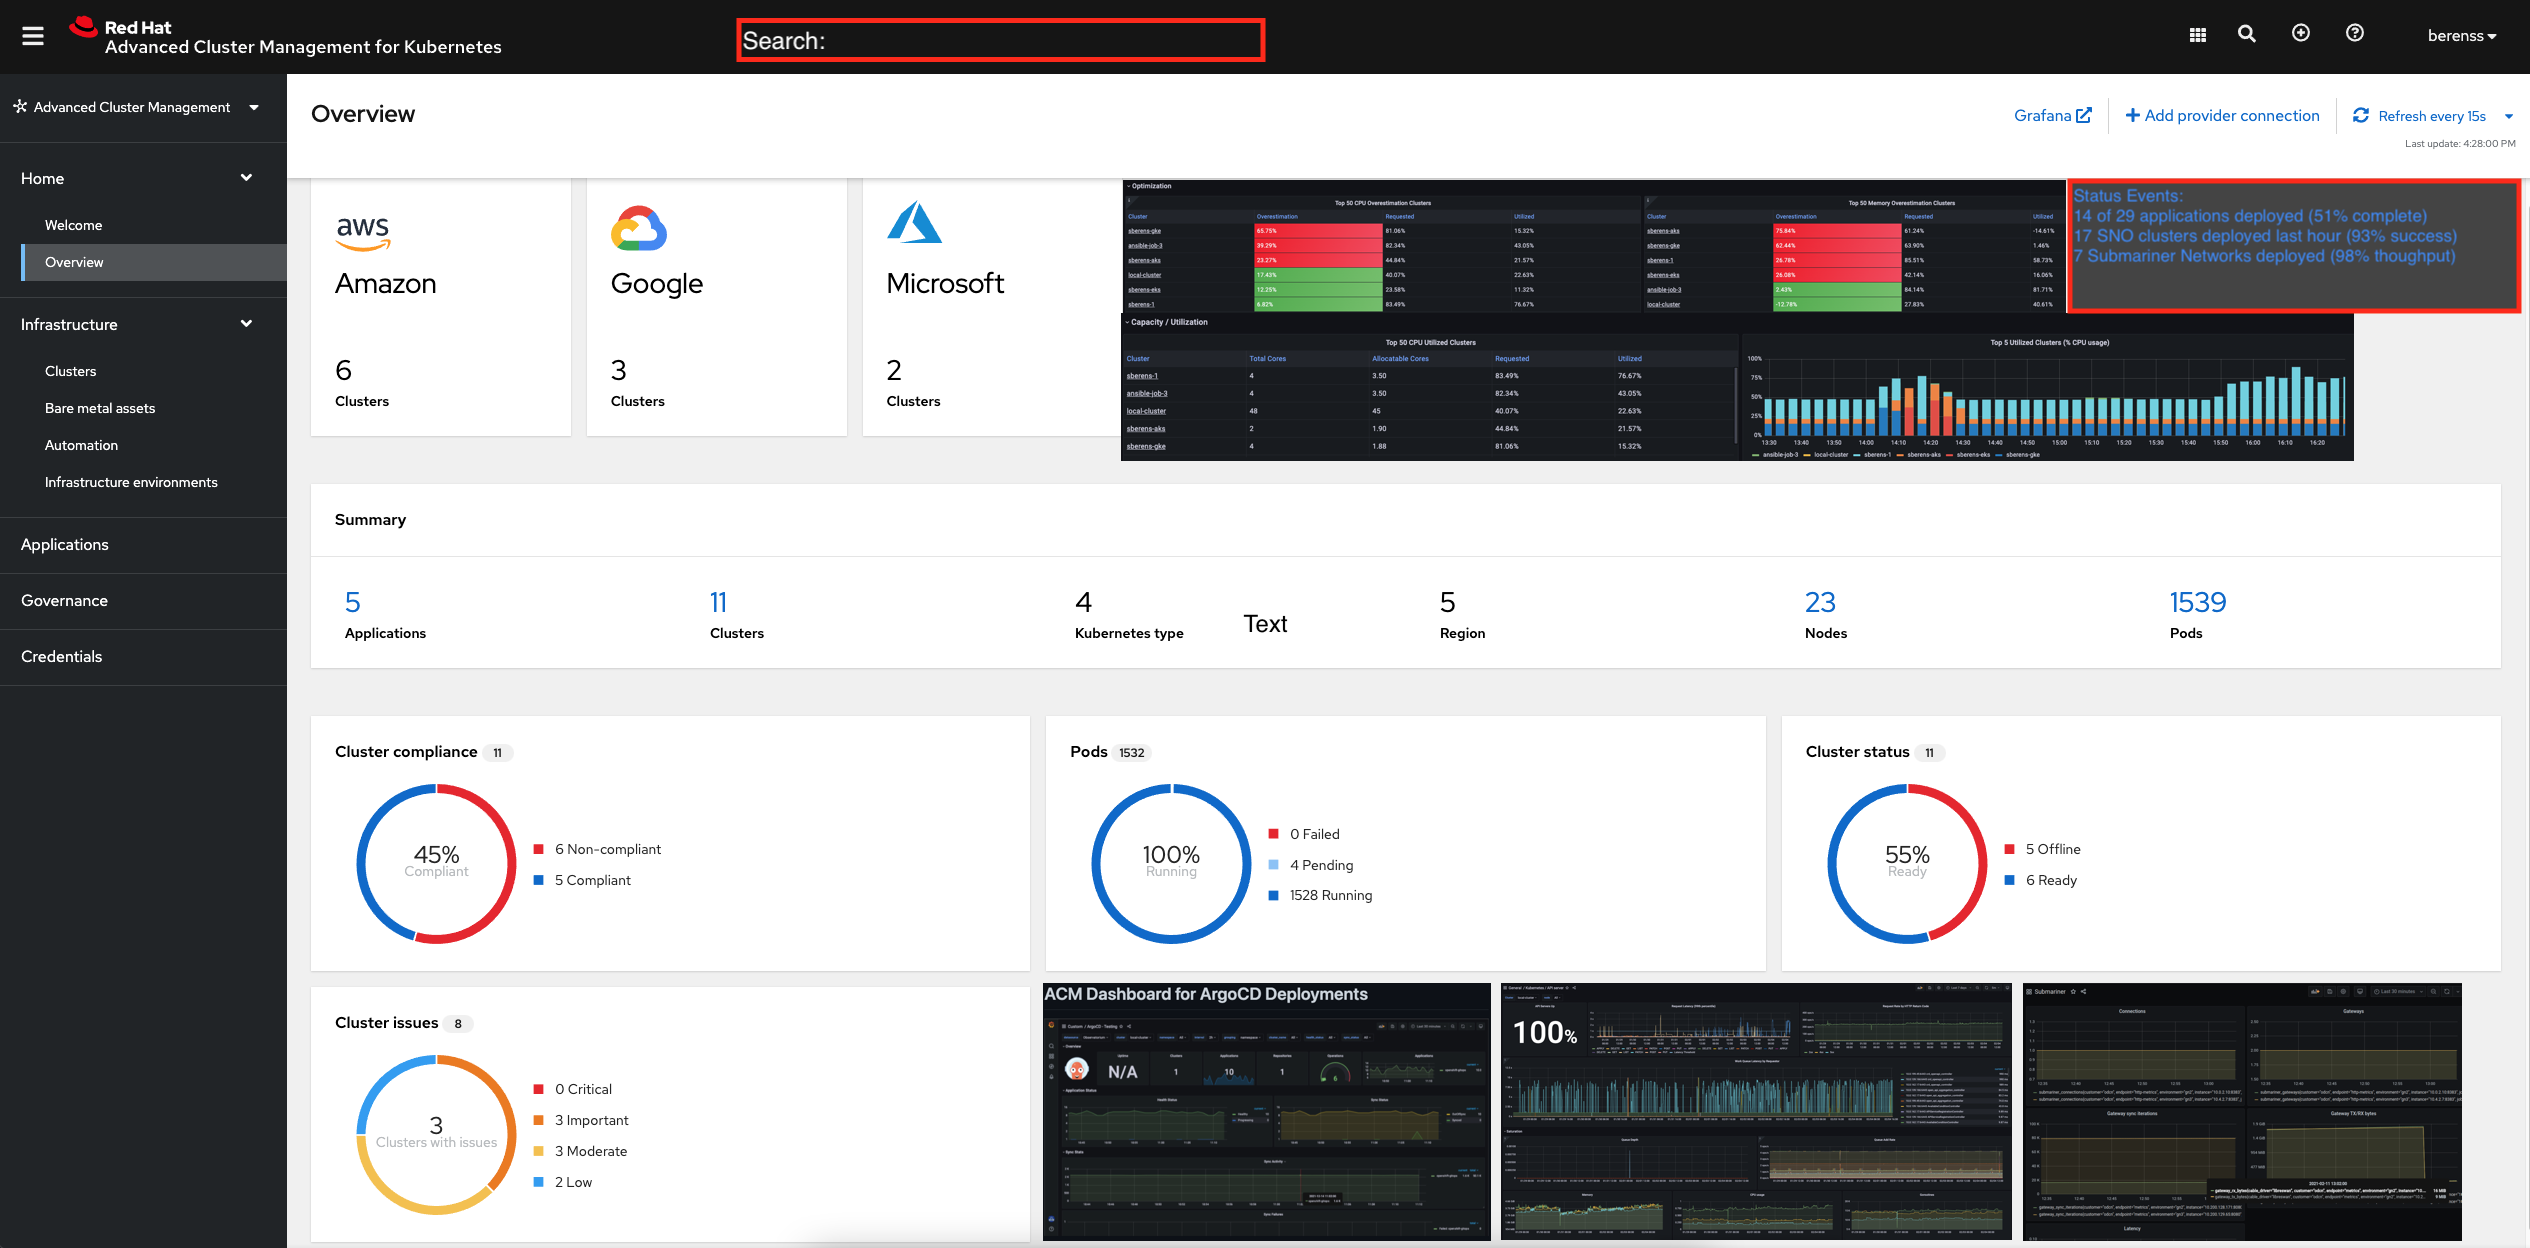
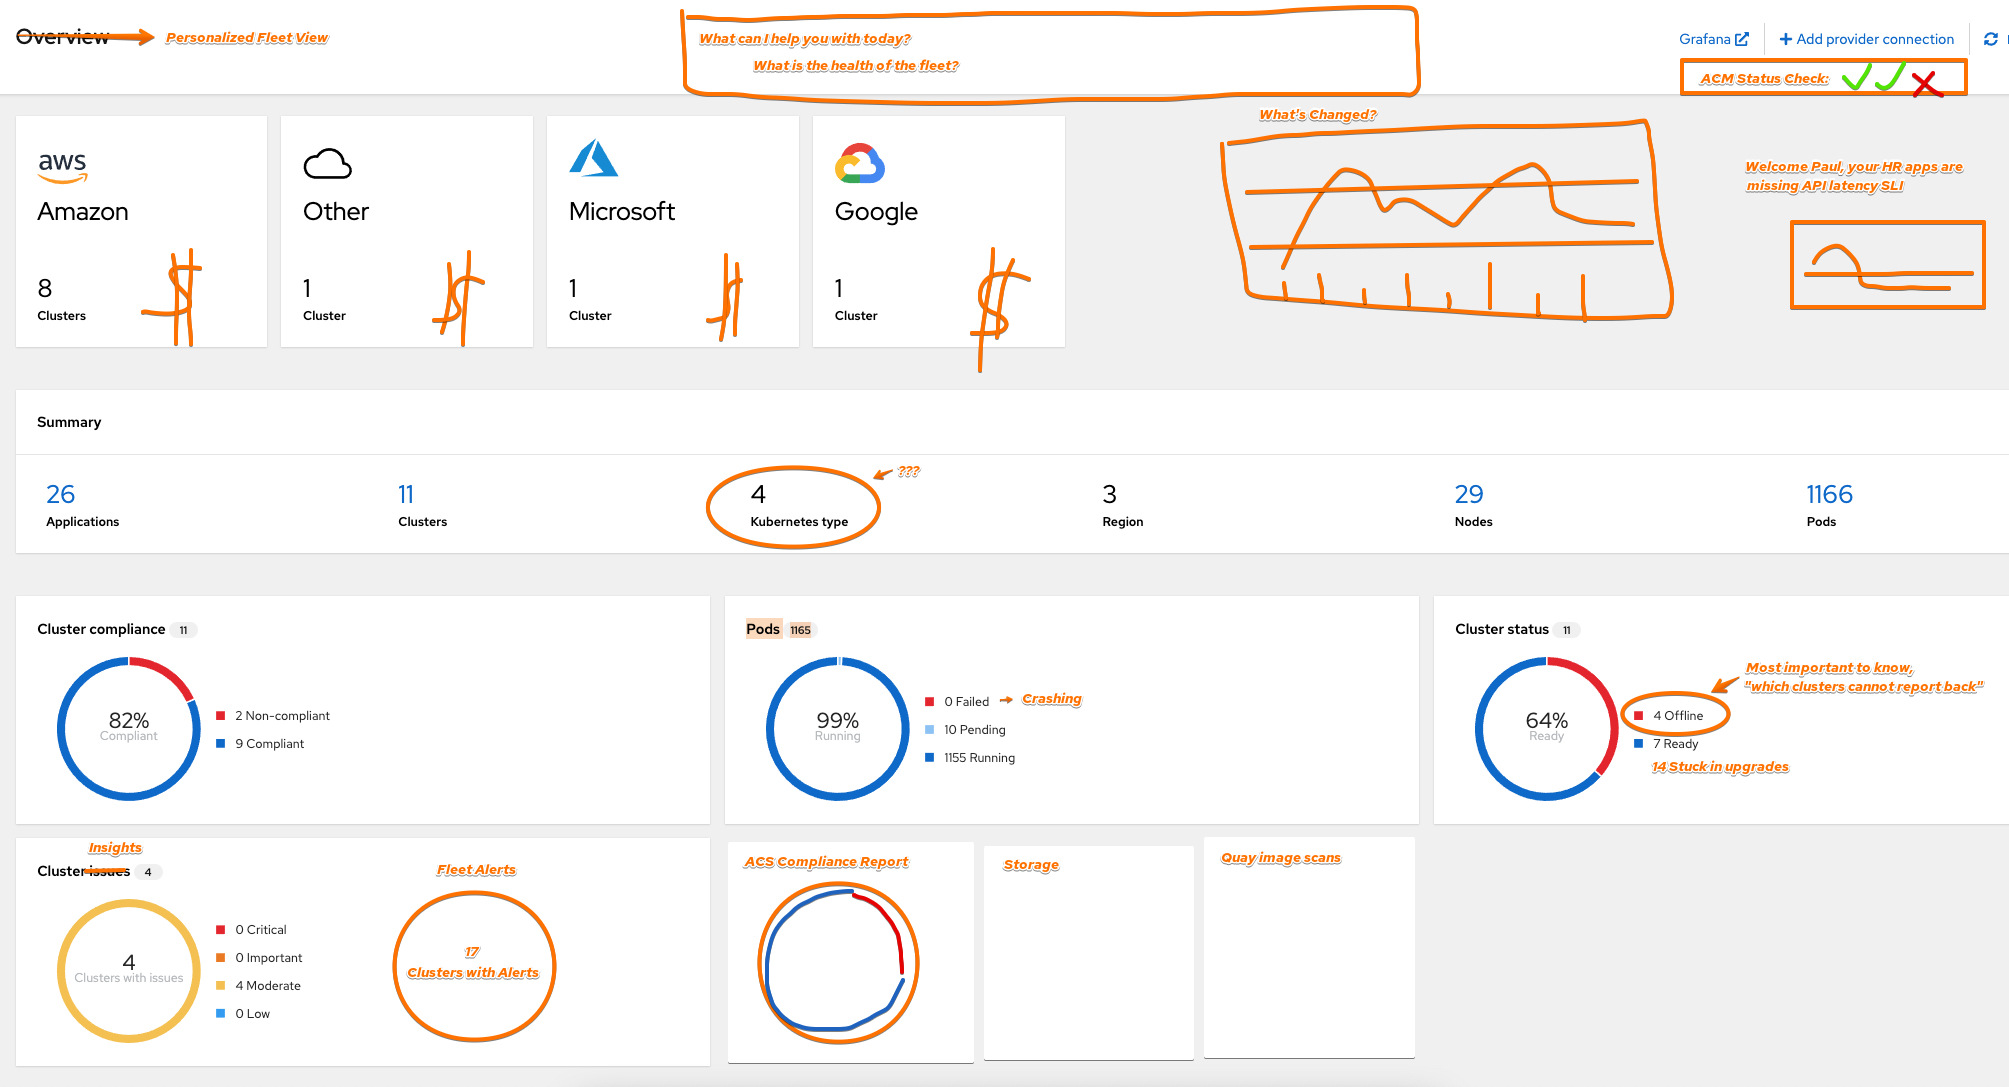
As an administrator of ACM, I need to know how performant I am across all pillar areas.
I need to know for example:
- What are the rate of application deployments and are they successfully reaching their target clusters within a defined criteria (seconds, minutes, % success)
- What are the success rates of SNO clusters being built per hour
- How quickly are cluster compliances being remediated such that the new configuration is in place and available for SecOps auditors
- Is my Networking throughput across the Submariner VPN tunnel a bottleneck to my CockroachDB being used for regional DR?
- A stream of events in the system for various kubernetes actions, like pods in CLBO, Deployments that are routinely flagging.
- Alerts from all components should be routed to AlertManager for 3rd party tooling.
- Stretch goal: The growing cost of my cloud spend due to over built clusters that are very under utilized.
How to do this?
- we need all ACM components to be instrumented to produce metrics and properly emit them into the platform prometheus.
- from those metrics we need to gather the most critical ones into a dashboard view and show that WITHIN ACM (not a launch-out).
- provide the ability to drill into the metrics to see better details about the system, down to a namespace, deployment, pod, container level.

