-
Bug
-
Resolution: Done
-
Blocker
-
17.0.0.Final, 17.0.1.Final, 18.0.1.Final
-
None
There seems to be a memory leak when a deployment is redeployed multiple times (100 times in our test). This is very similar to what has been described in WFLY-10991. Also first commit this started to happen is this one - JaegerTracing and Apache Thrift dependencies update. Thus I selected MP OpenTracing component for this issue.
Test and deployment is same as is described in WFLY-10991.
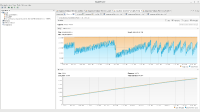
Size of the extra heap in use is about 27MB plus when compared to the initial size before multiple redeploy operations.
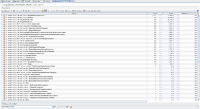
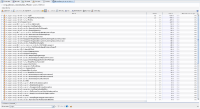
I've tried to check manually via visualVM tool. Screenshot with suspicious jaegertracing instances are attached - there are much more jaegertracing class instances with new version of Jager Tracing and Apache Thrift dependencies, which is suspicious.
Interesting thing is that when microprofile-opentracing-smallrye subsystem is removed via:
/subsystem=microprofile-opentracing-smallrye:remove()
the memory leak is still present. This is kind of confusing to me.
- is cloned by
-
JBEAP-18312 Memory leak in OpenTracing when deployment is redeployed multiple times
-
- Closed
-
- is incorporated by
-
WFLY-12758 Integrate MP OpenTracing 1.3 into WildFly
-
- Closed
-
- relates to
-
WFLY-10991 Memory leak when deployment is redeployed multiple times
-
- Closed
-


