-
Story
-
Resolution: Done
-
 Undefined
-
None
-
None
-
None
-
None
-
False
-
-
False
-
None
-
None
-
None
-
None
-
None
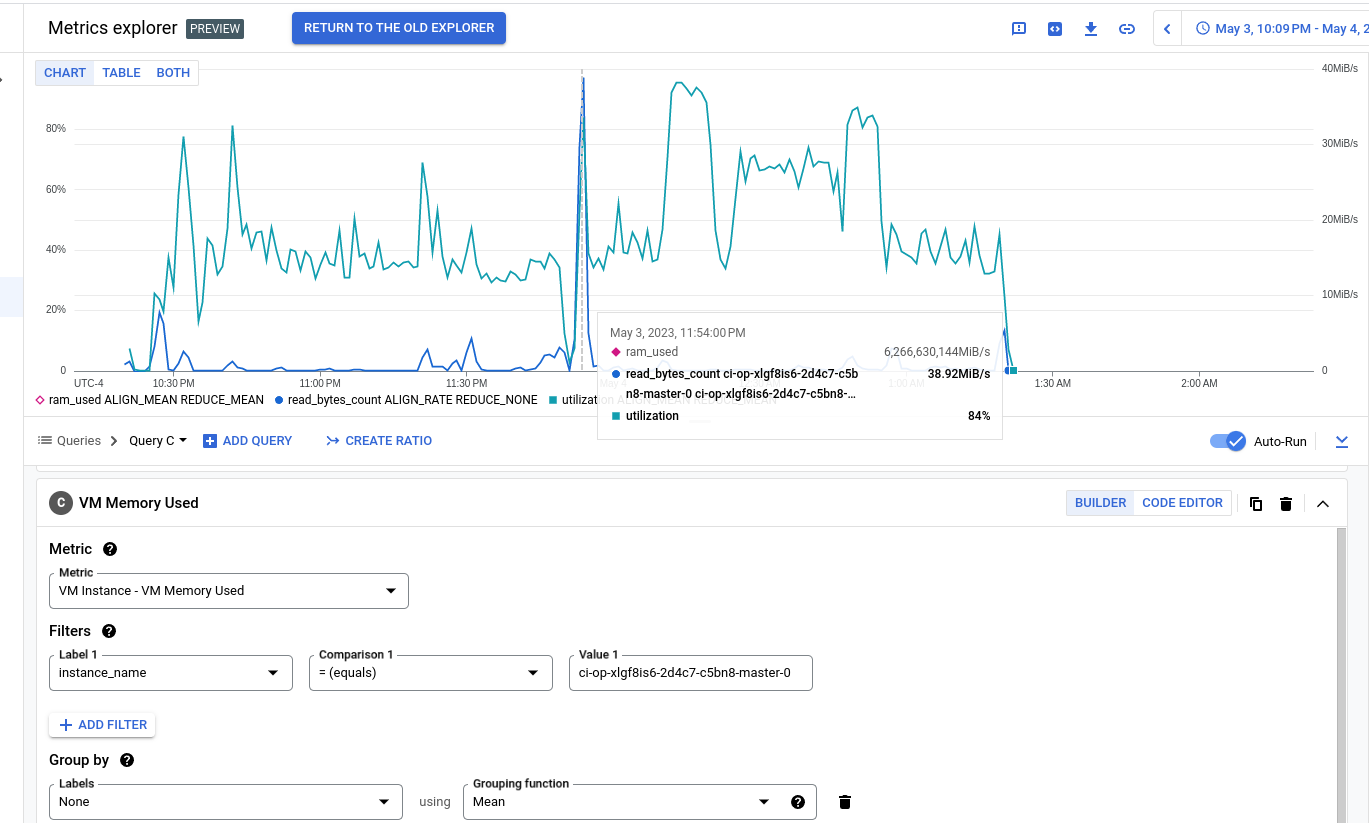
In the fallout of OCPBUGS-11591, I am wondering if we can identify worker CPU metrics, and load up some of the bad runs linked in the jira and check what the worker CPU was on a node going bad. Bad nodes can be identified by looking for the "Unreasonably long xxxxxxms poll interval".
Then compare what they look like now on good runs from this job: https://sippy.dptools.openshift.org/sippy-ng/jobs/4.14/runs?filters=%7B%22items%22%3A%5B%7B%22columnField%22%3A%22name%22%2C%22operatorValue%22%3A%22equals%22%2C%22value%22%3A%22periodic-ci-openshift-release-master-ci-4.14-e2e-gcp-ovn-upgrade%22%7D%5D%7D&sortField=timestamp&sort=desc

- is related to
-
OCPBUGS-11591 Mass sig-network test failures on GCP OVN
-

- Closed
-
