-
Story
-
Resolution: Unresolved
-
 Normal
-
None
-
None
-
None
-
Future Sustainability
-
False
-
-
False
-
None
-
None
-
None
-
None
-
None
Problem2: Stale flakes older than 2 days?
rhn-engineering-dgoodwin taught me on slack how to apply the currentRuns >= 1 filter so with that coupled with clicking the "2 day" period intead of the default 7 day period I get:
Two Day OCPFeatureGate:NetworkSegmentation
Yesterday I had ^ 35 rows RED; today its become 46 rows red -> I want to understand what/what/which flake
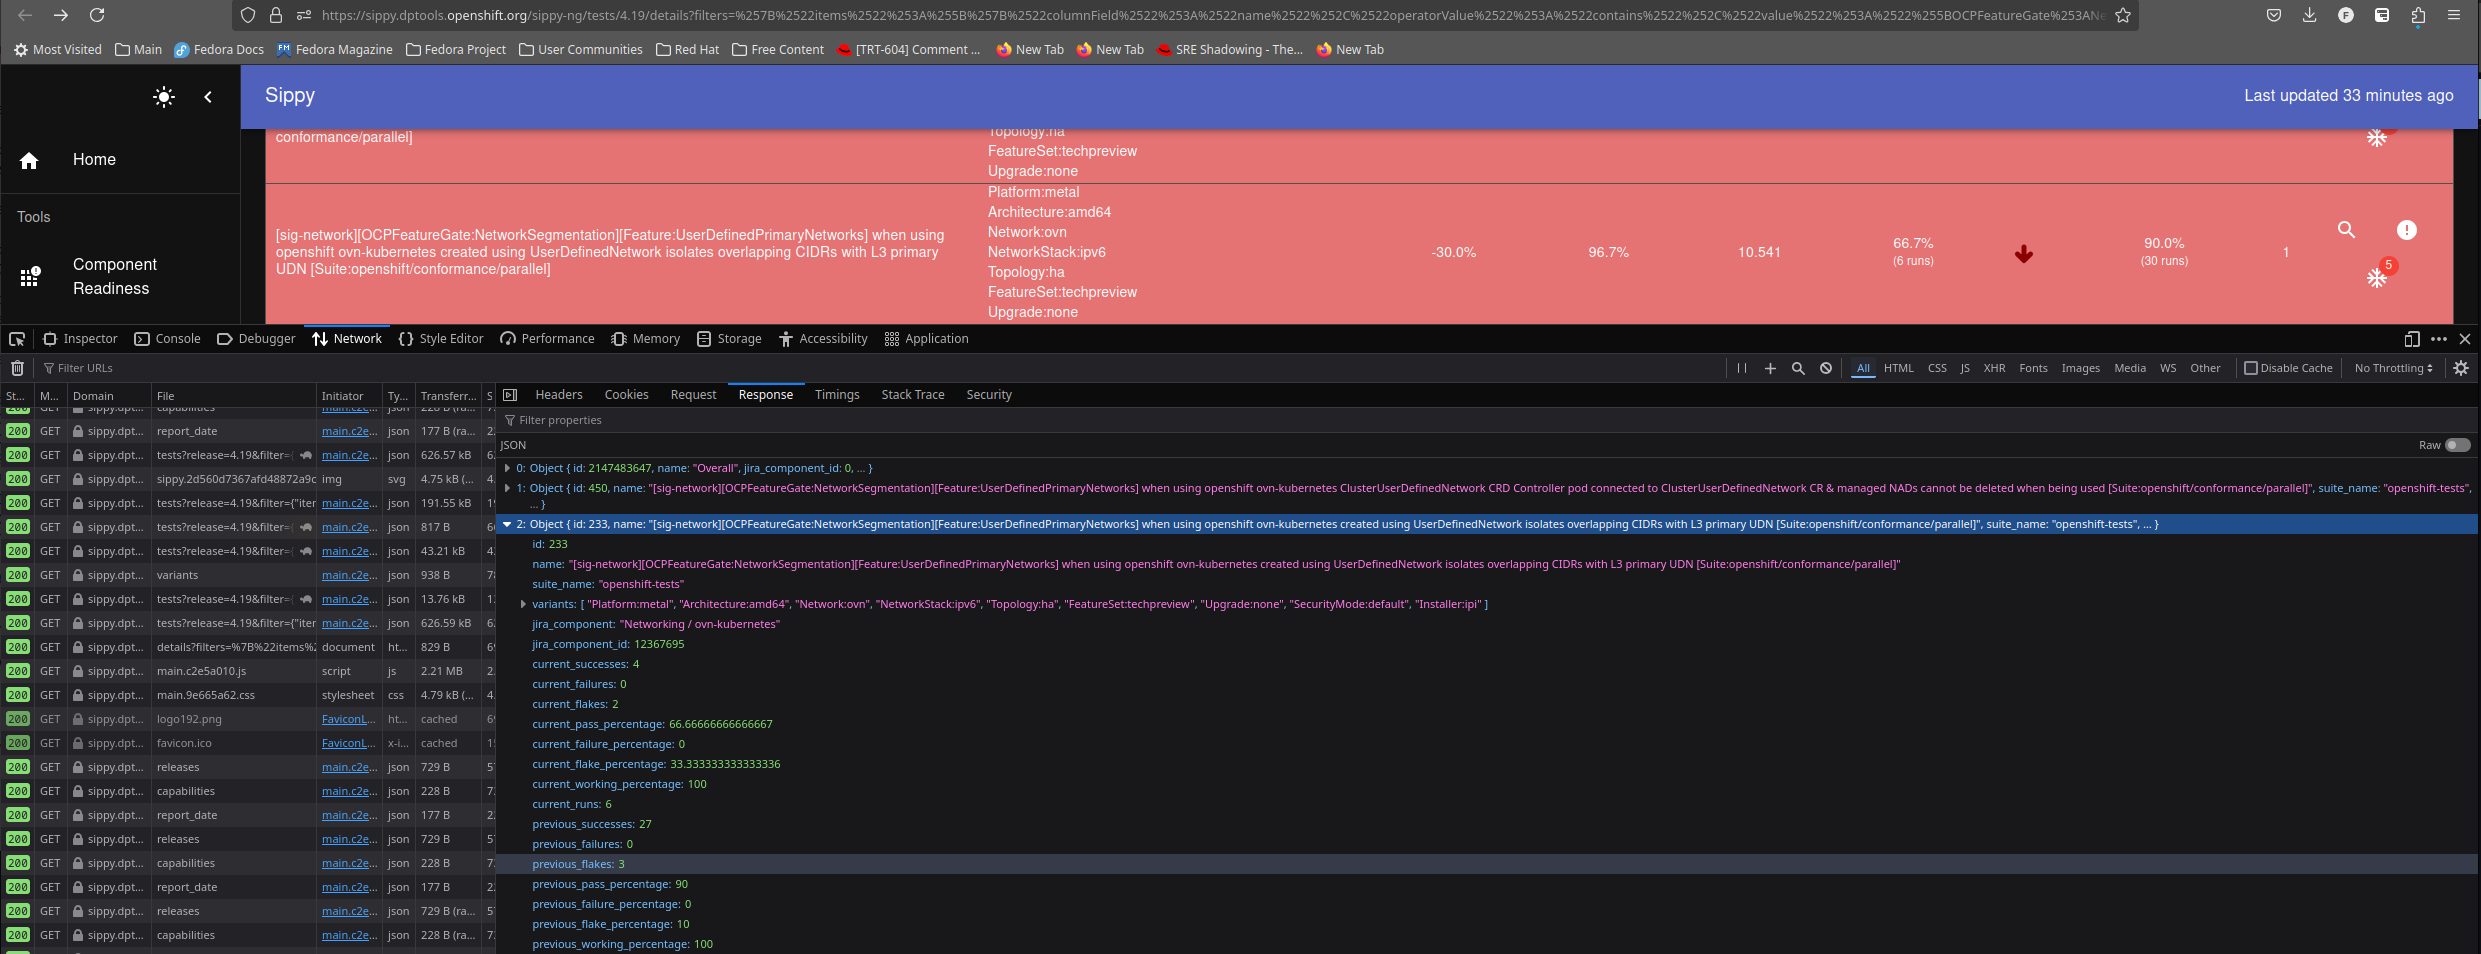
So when I start digging into the flakes, let's take the example:
the 1st red row for me which is:
I click on the snow flake button and I get: Flake Job Failures
which shows 3 flakes but one of them is from 19th? which is way older than 2 days why is that?
Similar failures/flakes exist in other jobs as run, so I don't think the 2 day filter is working well
- relates to
-
TRT-1984 Reconsider Test Report / Analysis Design
-

- Closed
-