In looking at a component readiness test page we see some failures that take a long time to load:
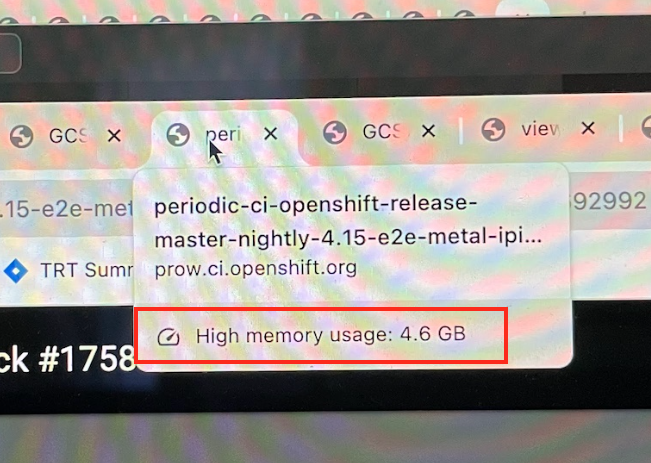
https://prow.ci.openshift.org/view/gs/test-platform-results/logs/periodic-ci-openshift-release-master-nightly-4.15-e2e-metal-ipi-ovn-dualstack/1758641985364692992 (I noticed that this one resulted in messages asking me to restart chrome)
https://prow.ci.openshift.org/view/gs/test-platform-results/logs/periodic-ci-openshift-release-master-nightly-4.16-e2e-metal-ipi-ovn-dualstack/1767279909555671040
https://prow.ci.openshift.org/view/gs/test-platform-results/logs/periodic-ci-openshift-release-master-nightly-4.16-e2e-metal-ipi-ovn-dualstack/1766663255406678016
https://prow.ci.openshift.org/view/gs/test-platform-results/logs/periodic-ci-openshift-release-master-nightly-4.16-e2e-metal-ipi-ovn-dualstack/1765279833048223744
We'd like to understand why it takes a long time to load these jobs and possible take some action to remediate as much of that slowness as possible.
Taking a long time to load prow jobs will make our TRT tools seem unusable and might make it difficult for managers to inspect Component Readiness failures which would slow down getting them resolved.
Some idea of what to look at:
- see if the file size of the jobs is any bigger now than before esp. for runs with a lot of failures
- see if the recent change that cuts the size of the intervals down is still working as expected
- compare the file size of a passing run vs. one with a lot of failures