Tempo has been deployed on standalone Red Hat OpenShift and is successfully running with the below TempoStack specification.
spec:
  hashRing:
    memberlist:
      instanceAddrType: podIP
  images: {}
  limits:
    global:
      ingestion: {}
      query:
        maxSearchDuration: 0s
  managementState: Managed
  observability:
    grafana:
      instanceSelector: {}
    metrics:
      createPrometheusRules: true
      createServiceMonitors: true
    tracing:
      jaeger_agent_endpoint: localhost:6831
      otlp_http_endpoint: http://localhost:4320
  replicationFactor: 1
  resources: {}
  retention:
    global:
      traces: 48h0m0s
  search:
    defaultResultLimit: 20
    maxDuration: 0s
  serviceAccount: tempo-sample
  storage:
    secret:
      name: aws-tempo
      type: s3
      credentialMode: static
    tls:
      enabled: true
  storageSize: 10Gi
  template:
    compactor:
      replicas: 1
    distributor:
      component:
        replicas: 1
      tls:
        enabled: false
    gateway:
      component:
        replicas: 1
      enabled: true
      ingress:
        route:
          termination: reencrypt
        type: route
      rbac:
        enabled: false
    ingester:
      replicas: 1
    querier:
      replicas: 1
    queryFrontend:
      component:
        replicas: 1
      jaegerQuery:
        enabled: true
        ingress:
          route: {}
        monitorTab:
          enabled: true
          prometheusEndpoint: https://thanos-querier.openshift-monitoring.svc.cluster.local:9091
        servicesQueryDuration: 72h0m0s
        tempoQuery: {}
  tenants:
    authentication:
    - tenantId: b0a5a73f-d95d-431e-b16c-118f37b2a4cb
      tenantName: tempo
    mode: openshift
  timeout: 30s
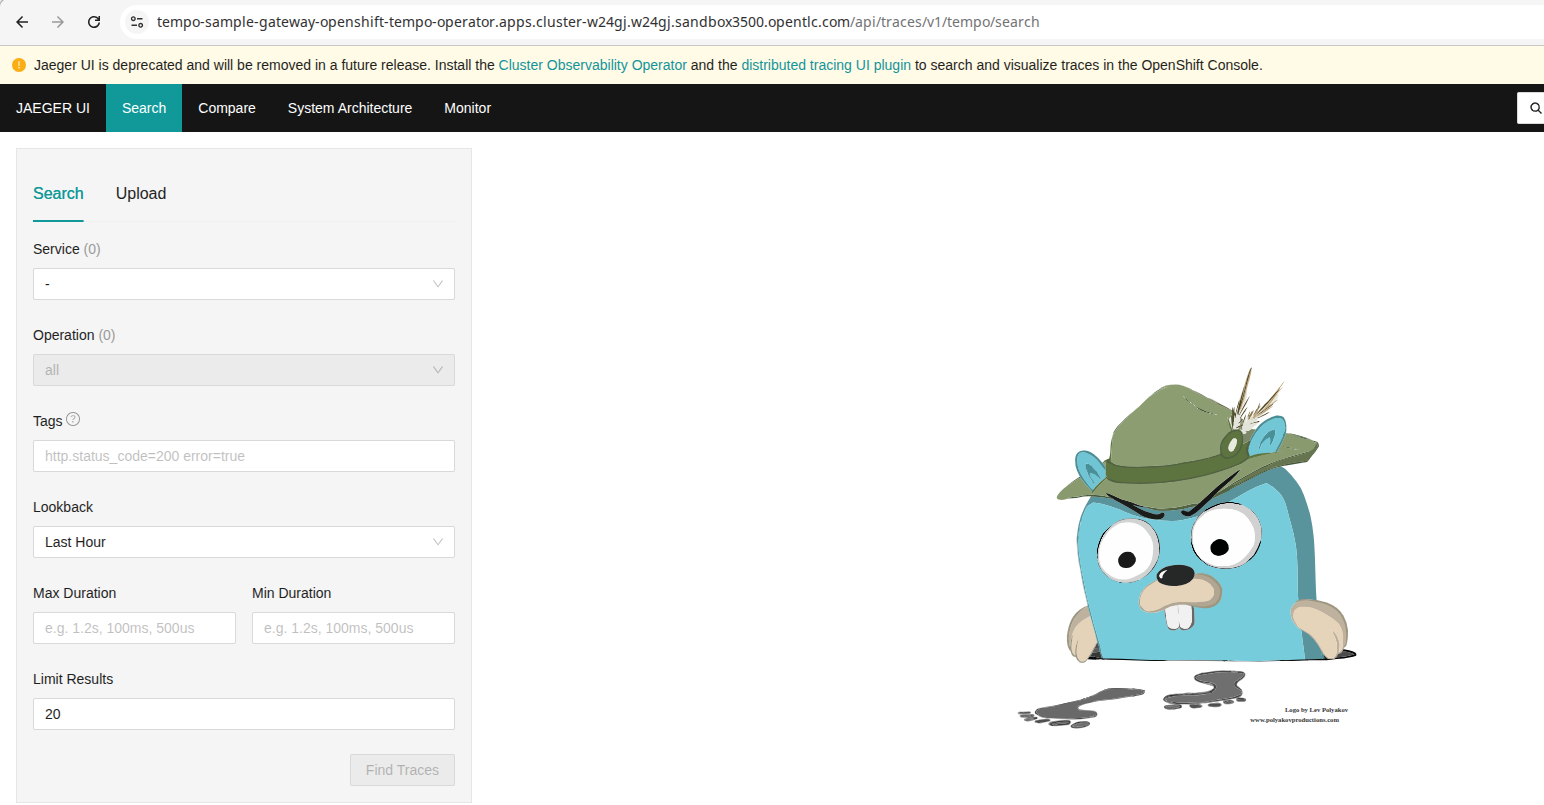
With this configuration in place, one can access https://tempo-foo-gateway-openshift-distributed-tracing.apps.foo.example.com/api/traces/v1/tempo/search and is ending up on the Jaeger UI as shown in the Screenshot.
When applying the same configuration on HostedCluster such as ROSA the same configuration is not working respectively returning tls: failed to verify certificate: x509: certificate signed by unknown authority for the oAuth callback (see screenshot).
Even though Jaeger UI is deprecated, this is rather cumbersome behavior and we'd like to understand why there is a difference in behavior and how to eventually solve it so that Standalone Red Hat OpenShift and HostedCluster does behave the same way.