-
Bug
-
Resolution: Done
-
Undefined
-
None
-
None
Version of components:
tempo-operator.v0.13.0-1
Description of the issue:
When a non multitenant TempoStack is installed with servicemonitors created.
    metrics:
      createPrometheusRules: true
      createServiceMonitors: true
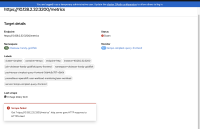
The scrape config in the servicemonitor is created for a Tempo frontend query endpoint with TLS enabled, which is not the case in a non-multitenant TempoStack. Due to which the metrics cannot be scraped from the stack. 
Steps to reproduce the issue:
1.Install the Tempo and OpenTelemetry operator.
2.Install the Minio storage.
3.Enable the user workload monitoring stack.
apiVersion: v1
kind: ConfigMap
metadata:
  name: cluster-monitoring-config
  namespace: openshift-monitoring
data:
  config.yaml: |
    enableUserWorkload: true
4.Create a non-multitenant TempoStack instance with the following CR.
apiVersion: tempo.grafana.com/v1alpha1
kind: TempoStack
metadata:
  name: simplest
spec:
  observability:
    metrics:
      createPrometheusRules: true
      createServiceMonitors: true
  storage:
    secret:
      name: minio
      type: s3
  storageSize: 200M
  resources:
    total:
      limits:
        memory: 2Gi
        cpu: 2000m
  template:
    queryFrontend:
      jaegerQuery:
        enabled: true
        ingress:
          type: route
5. Go to OCP web console > Observe > Targets and check the targets that are down. Tempo query frontend will be listed.
