-
Bug
-
Resolution: Done
-
Undefined
-
None
-
None
-
None
-
1
-
False
-
None
-
False
-
-
-
Tracing Sprint # 258
Version of components:
tempo-operator.v0.12.0-2
opentelemetry-operator.v0.107.0-1
OCP version 4.16
Description of the problem:
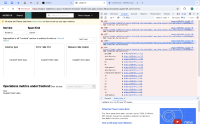
When Tempo monitorTab is enabled to view the span RED metrics, the monitorTab in the Jaeger console doesn't display any metrics data. In the browser developer console we see the following errors:
Failed to load resource: the server responded with a status of 500 (Internal Server Error)

index-VgFBvPml.js:153


       GET https://tempo-redmetrics-query-frontend-chainsaw-model-ewe.apps.ikanse-29.qe.devcluster.openshift.com/api/metrics/latencies?service=frontend&endTs=1724675446750&lookback=3600000&quantile=0.75&ratePer=600000&spanKind=server&step=60000 500 (Internal Server Error)

Steps to reproduce the issue:
*Install the Tempo and OTEL operator from the latest RHOSDT 3.3 build.
*Run the red-metrics test case with --skip-delete
chainsaw test --config .chainsaw-openshift.yaml --skip-delete tests/e2e-openshift/red-metrics/
*Once the test finishes, check the monitor tab in the Tempo frontend. No metrics data will be displayed.
