-
Bug
-
Resolution: Done
-
 Major
Major
-
None
-
1
-
False
-
-
False
-
-
-
Tracing Sprint # 258, Tracing Sprint # 260
-
Important
tempoVersion: 2.4.1 for both customer cases Iv'e seen so far
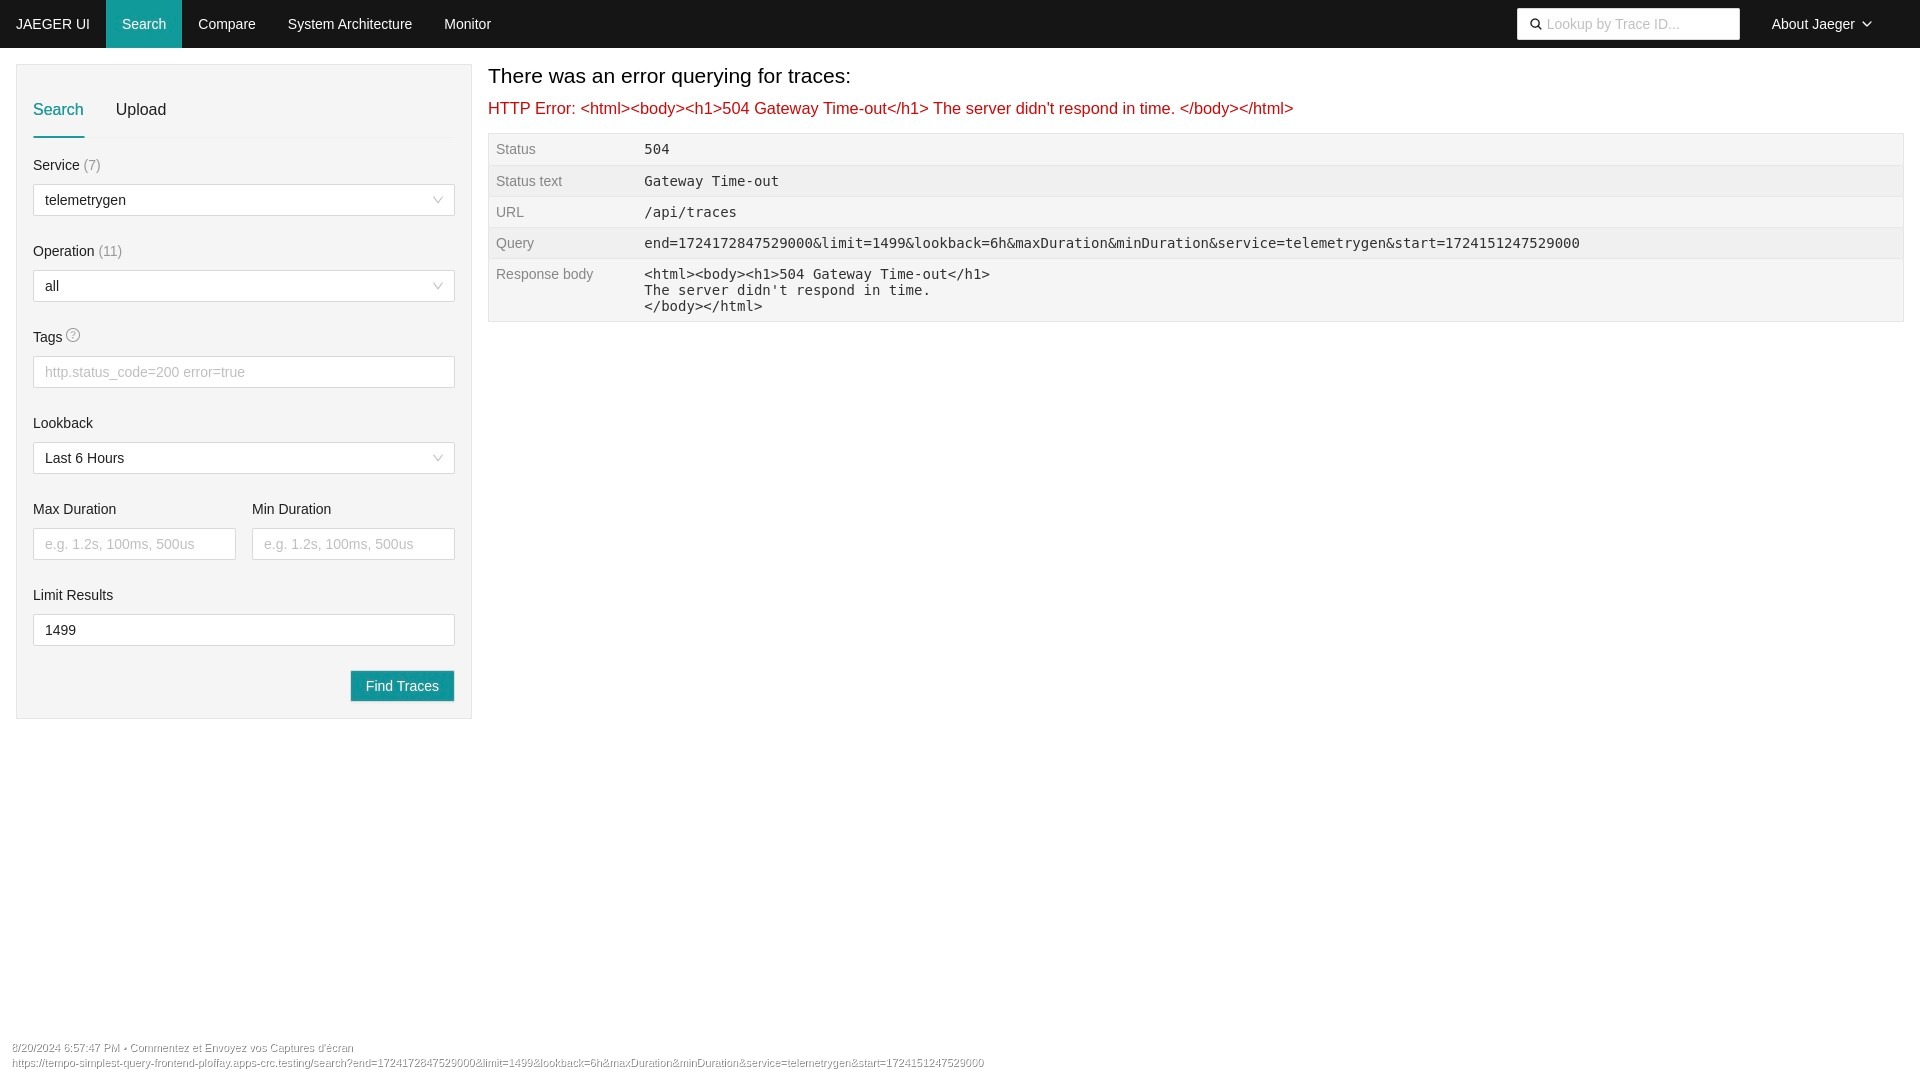
We seem to be hitting a limitation with tempo in regards to the Jaeger UI querying and what amount of results it can handle.
Unless the customer, while querying the parameters LookBack & Limit Results is set to lower(Less than 20) a 504 is returned as seen in the tempo-query logs
omg logs tempo-tempostack-query-frontend-8568765fcc-jvg6q -c tempo-query

2024-07-26T07:59:11.561305708Z {"level":"error","ts":1721980751.561069,"caller":"app/http_handler.go:504","msg":"HTTP handler, Internal Server Error","error":"stream error: rpc error: code = Canceled desc = context canceled","stacktrace":"github.com/jaegertracing/jaeger/cmd/query/app.(*APIHandler).handleError\n\t/remote-source/jaeger/app/cmd/query/app/http_handler.go:504\ngithub.com/jaegertracing/jaeger/cmd/query/app.(*APIHandler).search\n\t/remote-source/jaeger/app/cmd/query/app/http_handler.go:259\nnet/http.HandlerFunc.ServeHTTP\n\t/usr/lib/golang/src/net/http/server.go:2166\ngithub.com/jaegertracing/jaeger/cmd/query/app.(*APIHandler).handleFunc.traceResponseHandler.func2\n\t/remote-source/jaeger/app/cmd/query/app/http_handler.go:548\nnet/http.HandlerFunc.ServeHTTP\n\t/usr/lib/golang/src/net/http/server.go:2166\ngo.opentelemetry.io/contrib/instrumentation/net/http/otelhttp.WithRouteTag.func1\n\t/remote-source/jaeger/deps/gomod/pkg/mod/go.opentelemetry.io/contrib/instrumentation/net/http/otelhttp@v0.51.0/handler.go:249\nnet/http.HandlerFunc.ServeHTTP\n\t/usr/lib/golang/src/net/http/server.go:2166\ngo.opentelemetry.io/contrib/instrumentation/net/http/otelhttp.(*middleware).serveHTTP\n\t/remote-source/jaeger/deps/gomod/pkg/mod/go.opentelemetry.io/contrib/instrumentation/net/http/otelhttp@v0.51.0/handler.go:212\ngo.opentelemetry.io/contrib/instrumentation/net/http/otelhttp.NewMiddleware.func1.1\n\t/remote-source/jaeger/deps/gomod/pkg/mod/go.opentelemetry.io/contrib/instrumentation/net/http/otelhttp@v0.51.0/handler.go:73\nnet/http.HandlerFunc.ServeHTTP\n\t/usr/lib/golang/src/net/http/server.go:2166\nnet/http.HandlerFunc.ServeHTTP\n\t/usr/lib/golang/src/net/http/server.go:2166\ngithub.com/gorilla/mux.(*Router).ServeHTTP\n\t/remote-source/jaeger/deps/gomod/pkg/mod/github.com/gorilla/mux@v1.8.1/mux.go:212\ngithub.com/jaegertracing/jaeger/cmd/query/app.createHTTPServer.additionalHeadersHandler.func4\n\t/remote-source/jaeger/app/cmd/query/app/additional_headers_handler.go:28\nnet/http.HandlerFunc.ServeHTTP\n\t/usr/lib/golang/src/net/http/server.go:2166\ngithub.com/jaegertracing/jaeger/cmd/query/app.createHTTPServer.PropagationHandler.func5\n\t/remote-source/jaeger/app/pkg/bearertoken/http.go:52\nnet/http.HandlerFunc.ServeHTTP\n\t/usr/lib/golang/src/net/http/server.go:2166\ngithub.com/jaegertracing/jaeger/cmd/query/app.createHTTPServer.CompressHandler.CompressHandlerLevel.func6\n\t/remote-source/jaeger/deps/gomod/pkg/mod/github.com/gorilla/handlers@v1.5.1/compress.go:141\nnet/http.HandlerFunc.ServeHTTP\n\t/usr/lib/golang/src/net/http/server.go:2166\ngithub.com/gorilla/handlers.recoveryHandler.ServeHTTP\n\t/remote-source/jaeger/deps/gomod/pkg/mod/github.com/gorilla/handlers@v1.5.1/recovery.go:78\nnet/http.serverHandler.ServeHTTP\n\t/usr/lib/golang/src/net/http/server.go:3137\nnet/http.(*conn).serve\n\t/usr/lib/golang/src/net/http/server.go:2039"}
We've tried using multiple options with the TempoStack CDR including:
https://github.com/grafana/tempo-operator/blob/main/docs/spec/tempo.grafana.com_tempostacks.yaml
- Increasing replicas for query-frontend, tempo-querier, ingester
- Removing any resource limits or requests so it can use as much as it wants
- Messing with the defaultResultLimit value such as increasing it.
None have had any effect. All the components in Tempo are working properly and no errors are being reported about ingestion or the pushing of the logs. I will note both customer cases I see this in are using OTEL for pushing logs.
Neither of these clusters are large. One of them is only a 6 nodes cluster.
Both of these clusters are using ODF with S3 functionality.
Here is a tempostack resource spec from one customer
spec:
  observability:
    grafana:
      instanceSelector: {}
    metrics: {}
    tracing:
      jaeger_agent_endpoint: 'localhost:6831'
  resources: {}
  search:
    defaultResultLimit: 20
    maxDuration: 0s
  managementState: Managed
  limits:
    global:
      ingestion: {}
      query:
        maxSearchDuration: 0s
  serviceAccount: tempo-tempostack
  images: {}
  template:
    compactor:
      replicas: 2
    distributor:
      component:
        replicas: 2
      tls:
        enabled: false
    gateway:
      component: {}
      enabled: false
      ingress:
        route: {}
    ingester:
      replicas: 3
    querier:
      replicas: 3
    queryFrontend:
      component:
        replicas: 2
      jaegerQuery:
        enabled: true
        ingress:
          route:
            termination: edge
          type: route
        monitorTab:
          enabled: false
          prometheusEndpoint: ''
        servicesQueryDuration: 72h0m0s
  replicationFactor: 1
  storage:
    secret:
      name: tempo-bucket
      type: s3
    tls:
      enabled: false
  storageSize: 10Gi
  hashRing:
    memberlist: {}
  retention:
    global:
      traces: 48h0m0s
Either way the key takeaway is that if we go about a certain number then we will get a 504 timeout after 30 seconds. This implies a limitation or that the tempo stack can't get the results back in time but these clusters are not large.
Wondering if were just hitting a limit with tempo or some sort of bug and how we can continue to troubleshoot this as we have exhausted options we can configure via the tempostack. Would increasing the timeout on the frontend route that's created help?
Please let me know if there's any metrics we can gather and if there's anything more we can adjust even unsupported to test with
I''ll attach the cases via Jira