-
Bug
-
Resolution: Done
-
Undefined
-
None
-
None
-
None
-
1
-
False
-
-
False
-
-
-
Tracing Sprint # 257
Version of components:
OpenShift version: 4.17.0-0.nightly-2024-07-20-191204
opentelemetry-operator.v0.104.0
Description of the problem:
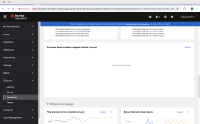
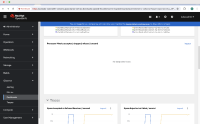
The OpenShift OpenTelemetry collector dashboard is missing data points for Processor Metrics accepted, dropped, refused / second and Processor Spans accepted, dropped, refused / second.
Steps to reproduce the issue:
*Install OpenTelemetry collector built off the latest upstream branch.
*Create a OpenTelemetry collector instance with enableMetrics: true and metrics traces sent to the OTEL receiver. You can run this test case with --skip-delete chainsaw option.
*Check the OTEL collector dashboard in OCP web console. The data points are missing for Processor Spans accepted, dropped, refused / second and Processor Metrics accepted, dropped, refused / second
Additional notes:
Tried with batch processor however the metrics used by dashboard for processor related metrics is not exposed by collector instance.
Tried with memory_limiter processor and able to see the metrics for the processor as well as the data in the dashboard for the processor.
We need a docs note which mentions this for the feature.

