This issue started from this comment: https://gitlab.cee.redhat.com/red-hat-3scale-documentation/3scale-documentation/-/merge_requests/1310#note_6453575
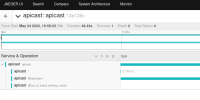
With opentracing, APICast generates multiple spans (1 parent span, 3 descendants) with the shared traceID:
- Span 1: Operation name: "apicast"
- Span 1.1: Operation name: /
- Span 1.2: Operation name: "@upstream"
- Span 1.3: Operation name: "@out_of_band_authrep_action"
See opentracing.png image as example
Whereas opentelemetry instrumentation, APICast only generates 1 span (for 1 service and 1 operation)
- Span 1: Operation name: "apicast"
See opentelemetry.png image as example
The main purpose is provide details about time taken to perform upstream and backend actions
Proposed solution
- Apicast operation will not generate spans for operations like "/", "@upstream" or "@out_of_band_authrep_action". Each component should generate it's own tracing report.
- The span generated by APIcast should be used as parent span for upstream and backend spans
- APICast will propagate distributed tracing headers, e.g. traceparent, to upstream (already done) and backend. Note that APicast will request backend in two scenarios: in-band and out-of-band. Both scenarios should have the distributed tracing headers being propagated with the parent span ID being the span ID auto-generated by APIcast.
- 3scale Backend should be instrumented using opentelemetry SDK. Sinatra has instrumentation in place implemented in https://github.com/open-telemetry/opentelemetry-ruby-contrib/tree/main/instrumentation/sinatra
- Upstream, which is not managed by 3scale, should also add instrumentation to add more tracing data
1.
|
Propagate distributed tracing headers, e.g. traceparent, to backend |
|
To Develop | |
Unassigned |

