-
Bug
-
Resolution: Done
-
 Major
Major
-
2.10 ER2
-
False
-
False
-
Not Started
-
Not Started
-
Not Started
-
Not Started
-
Not Started
-
Not Started
-
No
-
Undefined
-
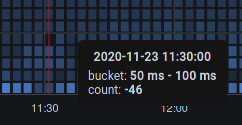
When 3scale is deployed with monitoring enabled Grafana Dashboards are created. When we look inside running grafana instance Grafana Dashboards are created but there are several bugs...
there are sometimes in heatmaps negative values which does not make sense (request per second heatmap) is the query correct?
liveness requests per sec heatmap and readiness requests per sec heatmap does not have any values but it should have because there are liveness and readiness probes on system containers set up.

- is cloned by
-
-
- Closed
-
- relates to
-
THREESCALE-5722 Make monitoring resources available through the 3scale Operator (Phase 2)
-

- Closed
-
-
-
- Closed
-
-
-
- Closed
-
- links to

