Uploaded image for project: 'Red Hat 3scale API Management'
  1. Red Hat 3scale API Management
  2. THREESCALE-58

Analytics in Developer portal - Graph not shown due an error in JavaScript

XMLWordPrintable

    • Icon: Bug Bug
    • Resolution: Done
    • Icon: Minor Minor
    • 2.0 ER3
    • 2.0 ER2
    • System
    • None
    • Hide

      Login to developer portal
      Open Statistics
      Have opened gray panel with options to switch between draft and published version

      Show
      Login to developer portal Open Statistics Have opened gray panel with options to switch between draft and published version

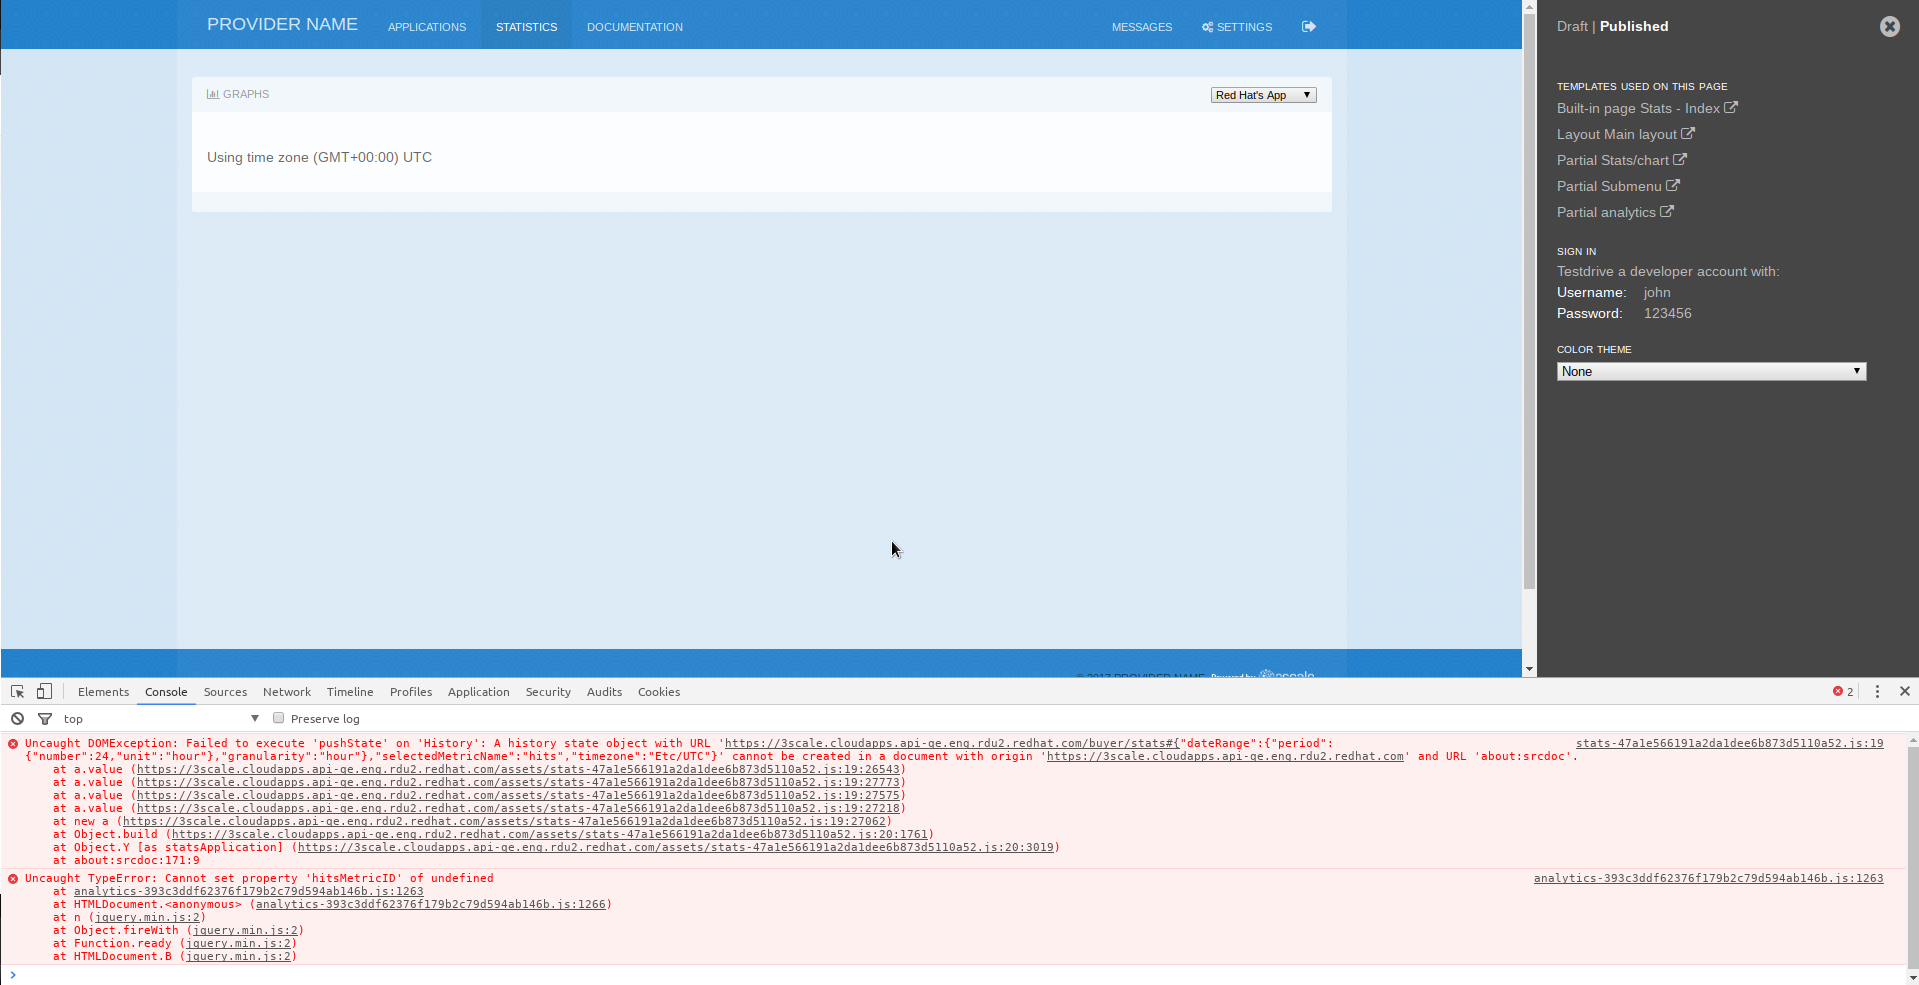
      There is an error shown in console due which, there is no graph shown in Google chrome.
      This error occur when you also have opened side panel with development options (gray panel)
      After I closed it graph is shown normally.

      I have attached a screen-shot.

      This isn't happening when panel is closed.

            Unassigned Unassigned
            pstanko@redhat.com Peter Stanko (Inactive)
            Votes:
            0 Vote for this issue
            Watchers:
            2 Start watching this issue

              Created:
              Updated:
              Resolved: