-
Quality Risk
-
Resolution: Done
-
Major
-
None
-
None
-
None
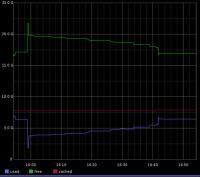
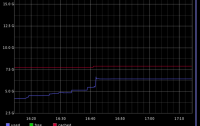
We hare having trouble with memory allocation on our JDV server (using Red Hat JBoss Data Virtualization - Version 6.3.0) for some reason memory gets allocated but never released.
For simple queries memory increases just a little, however when we make complex joins etc, we are seeing scenarios with 20GB+ allocated heap.
I wonder if there is any inspection tool for debugging what is consuming it in JDV.
Our main datasource is an Oracle DS, but we do have a MariaDB being used too.

