-
Story
-
Resolution: Done
-
 Major
Major
-
2023-07-24 - GUI
-
None
-
False
-
-
False
-
-
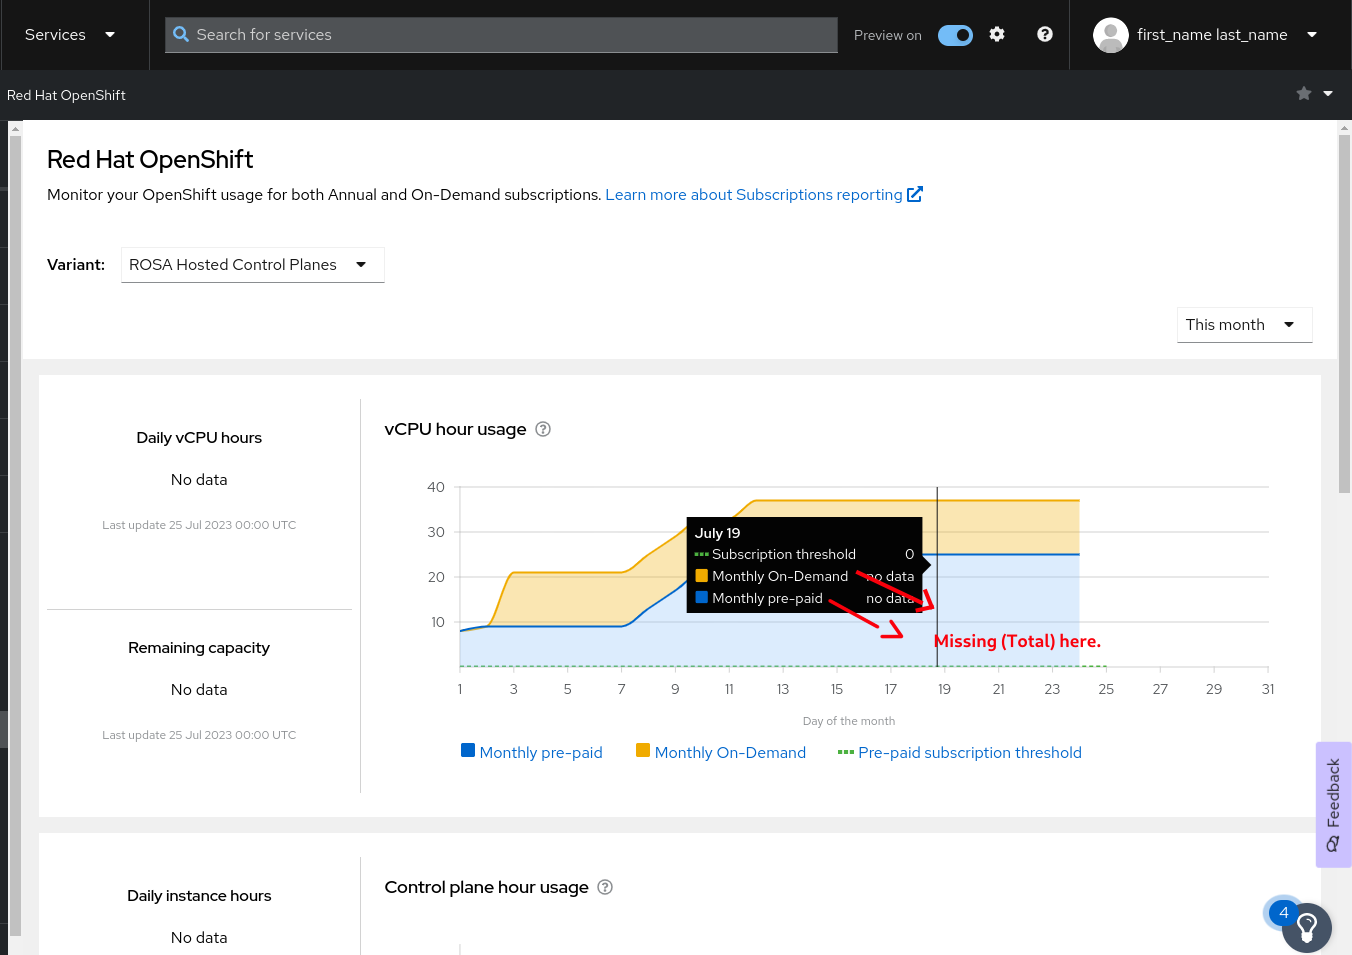
As a frontend developer I need to minimally display the "total" value only. See the display in the attached storyboard and screenshot. This should allow existing configuration to adapt to the requested update.
Assumptions and questions
- The current graph tooltip has the current limitation of 1 to 1 metric, legend, tooltip display.
- If time allows and additional metrics are allowed in the configuration and generation of graph tooltips... the new display should allow the ability to pass and customize the tooltip to display and handle metrics that are only loosely related... ie dump random data into it.
- https://www.sketch.com/s/a41f48e4-9391-45b6-8952-d4e11590331d/a/09mJVqA
- Reduced tooltip is the first round state
- is blocked by
-
-
- Closed
-
