-
Bug
-
Resolution: Done
-
 Undefined
-
1.14.0
-
None
-
False
-
False
-
Undefined
-
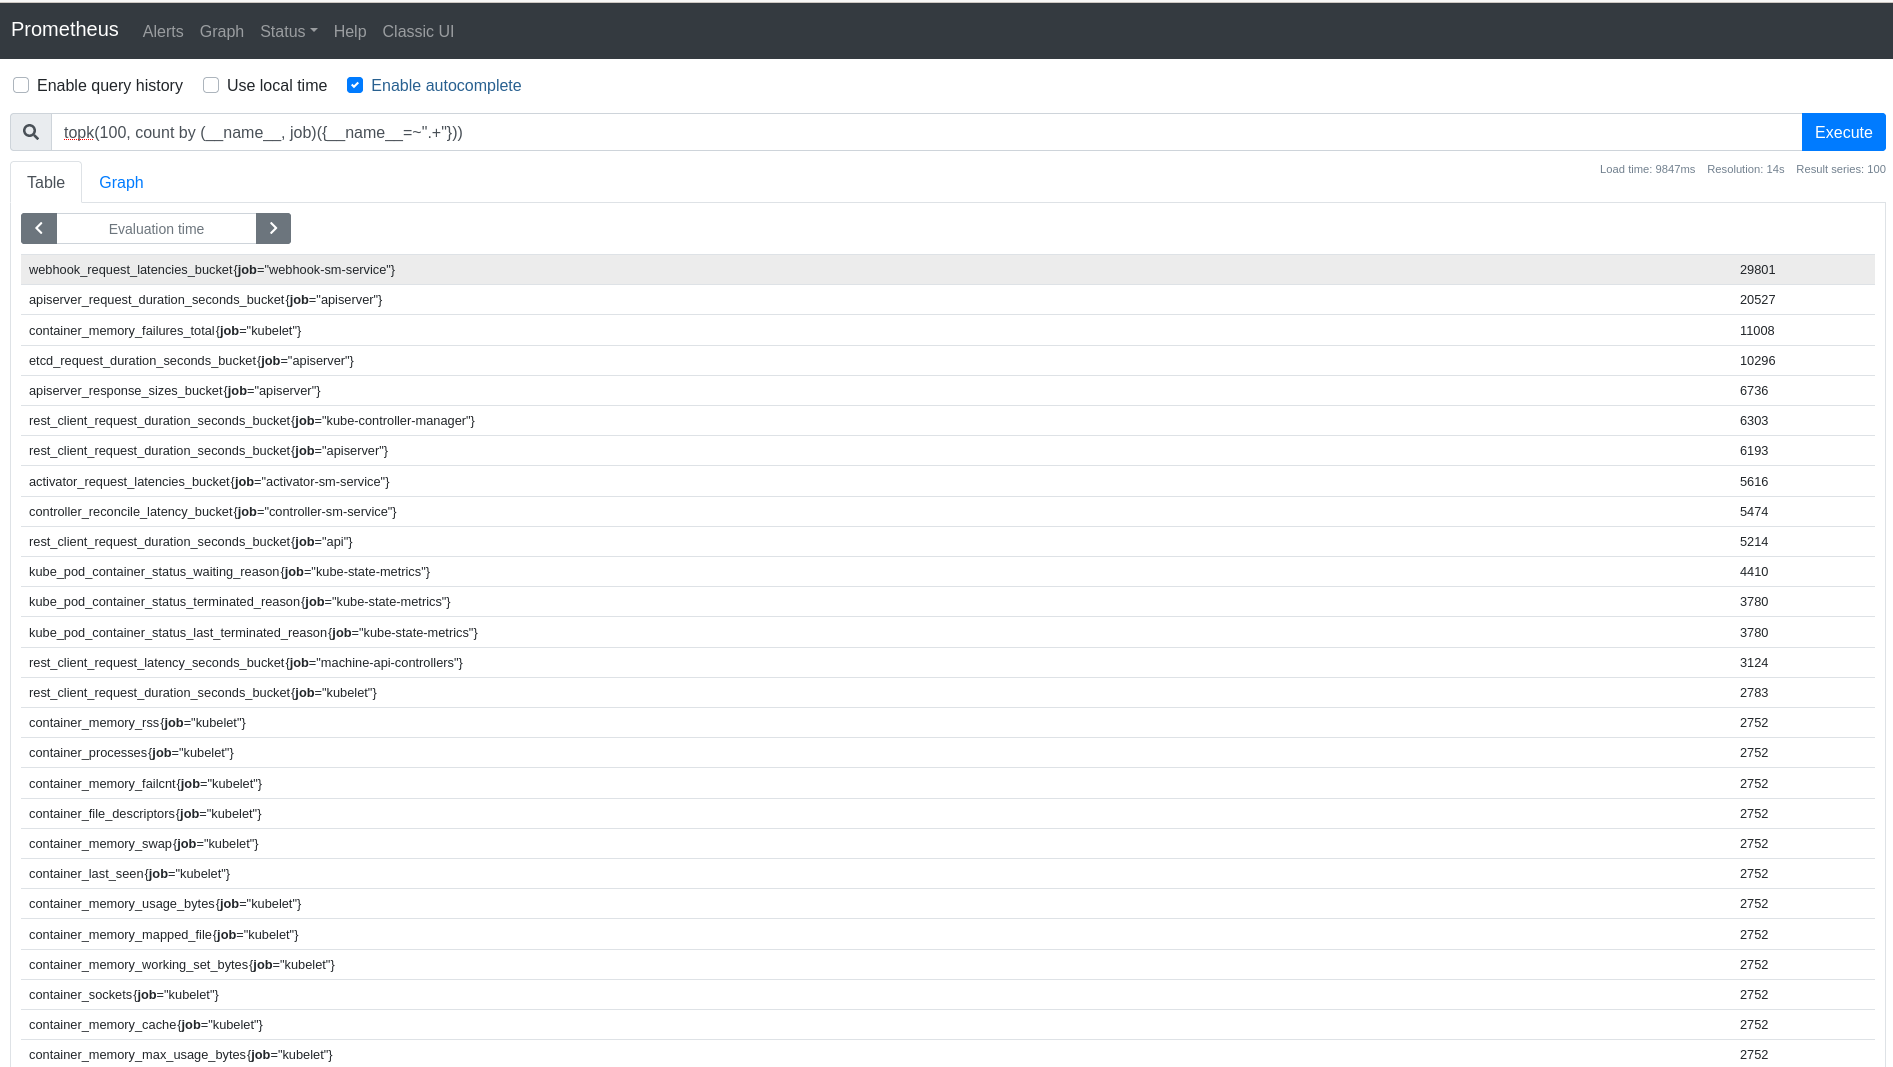
On a cluster with ~50 namespaces containing a ksvc, the webhook_request_latencies_bucket{job="webhook-sm-service"} is the single largest metric on the cluster with 29801 time series (which is more than the API servers'
examples
webhook_request_latencies_bucket{admission_allowed="false", endpoint="https", instance="10.128.2.33:8444", job="webhook-sm-service", kind_group="networking.internal.knative.dev", kind_kind="Ingress", kind_version="v1alpha1", le="+Inf", namespace="knative-serving", pod="webhook-576b57b4d6-glxhp", request_operation="UPDATE", resource_group="networking.internal.knative.dev", resource_namespace="helloworld-re-sn-0", resource_resource="ingresses", resource_version="v1alpha1", service="webhook-sm-service"}   436

webhook_request_latencies_bucket{admission_allowed="false", endpoint="https", instance="10.128.2.33:8444", job="webhook-sm-service", kind_group="networking.internal.knative.dev", kind_kind="Ingress", kind_version="v1alpha1", le="+Inf", namespace="knative-serving", pod="webhook-576b57b4d6-glxhp", request_operation="UPDATE", resource_group="networking.internal.knative.dev", resource_namespace="helloworld-re-sn-1", resource_resource="ingresses", resource_version="v1alpha1", service="webhook-sm-service"}   424
It seems it has a time series for each
bucket * namespace * kind * operation
for any namespace with a ksvc, for all kinds of knative kinds...
( there are 17 buckets, and (kind * operation) seems to be around 32, so there are about 544 time series per namespace)
Notice the `resource_namespace` label, which means there are bucket time series for each namespace... (also note that even the OpenShift apiserver_request_duration_seconds_bucket metric doesn't distinguish namespaces, so it IMHO seems excessive to distinguish it for the webhook_request_latencies_bucket metric))
See also the discussion https://coreos.slack.com/archives/CD87JDUB0/p1619024836262000
