-
Bug
-
Resolution: Done
-
 Undefined
-
None
-
None
-
False
-
-
False
-
-
Description of problem:
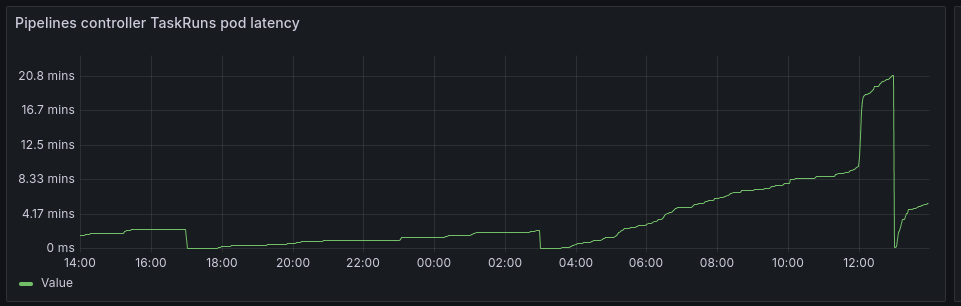
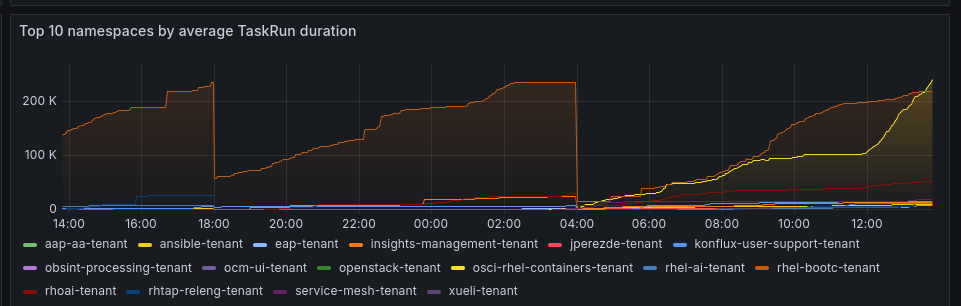
The following metrics on the Tekton Pipelines controller appear to reset themselves every 10 hours:
- tekton_pipelines_controller_pipelinerun_taskrun_duration_seconds_*
- tekton_pipelines_controller_taskruns_pod_latency_milliseconds
Workaround: None
Prerequisites (if any, like setup, operators/versions):
- OpenShift Pipelines 5.0.5-492 on OCP 4.15
- Grafana or other visualizer for Prometheus metrics
Steps to Reproduce
- Deploy OpenShift Pipelines v5.0.5-492, with Grafana
- Set up a Grafana to plot one or more of the following metrics over a period of 20+ hours:
- tekton_pipelines_controller_pipelinerun_taskrun_duration_seconds_*
- tekton_pipelines_controller_taskruns_pod_latency_milliseconds
Actual results:
Every 10 hours (on a specific hour mark), the telemetry metrics reset to 0.
Expected results:
Telemetry metrics do not reset
Reproducibility (Always/Intermittent/Only Once):
Every 10 hours
Acceptance criteria:
Definition of Done:
Build Details:
OpenShift Pipelines 5.0.5-492
OpenShift 4.15.31
Observed on Konflux stone-prd-p02 cluster 2024-11-11.
Additional info (Such as Logs, Screenshots, etc):


- is depended on by
-
SRVKP-8141 [TRACKER] [release testing] Bug verification
-

- Closed
-
- is incorporated by
-
SRVKP-8551 Upgrade Konflux nightly build
-
- Closed
-