Uploaded image for project: 'OpenShift Pipelines'
  1. OpenShift Pipelines
  2. SRVKP-5835

Pipeline metrics queries gives inconsistent values for 3 month time interval and there are inconsistent decrements in values

XMLWordPrintable

    • False
    • None
    • False

      Description of problem:

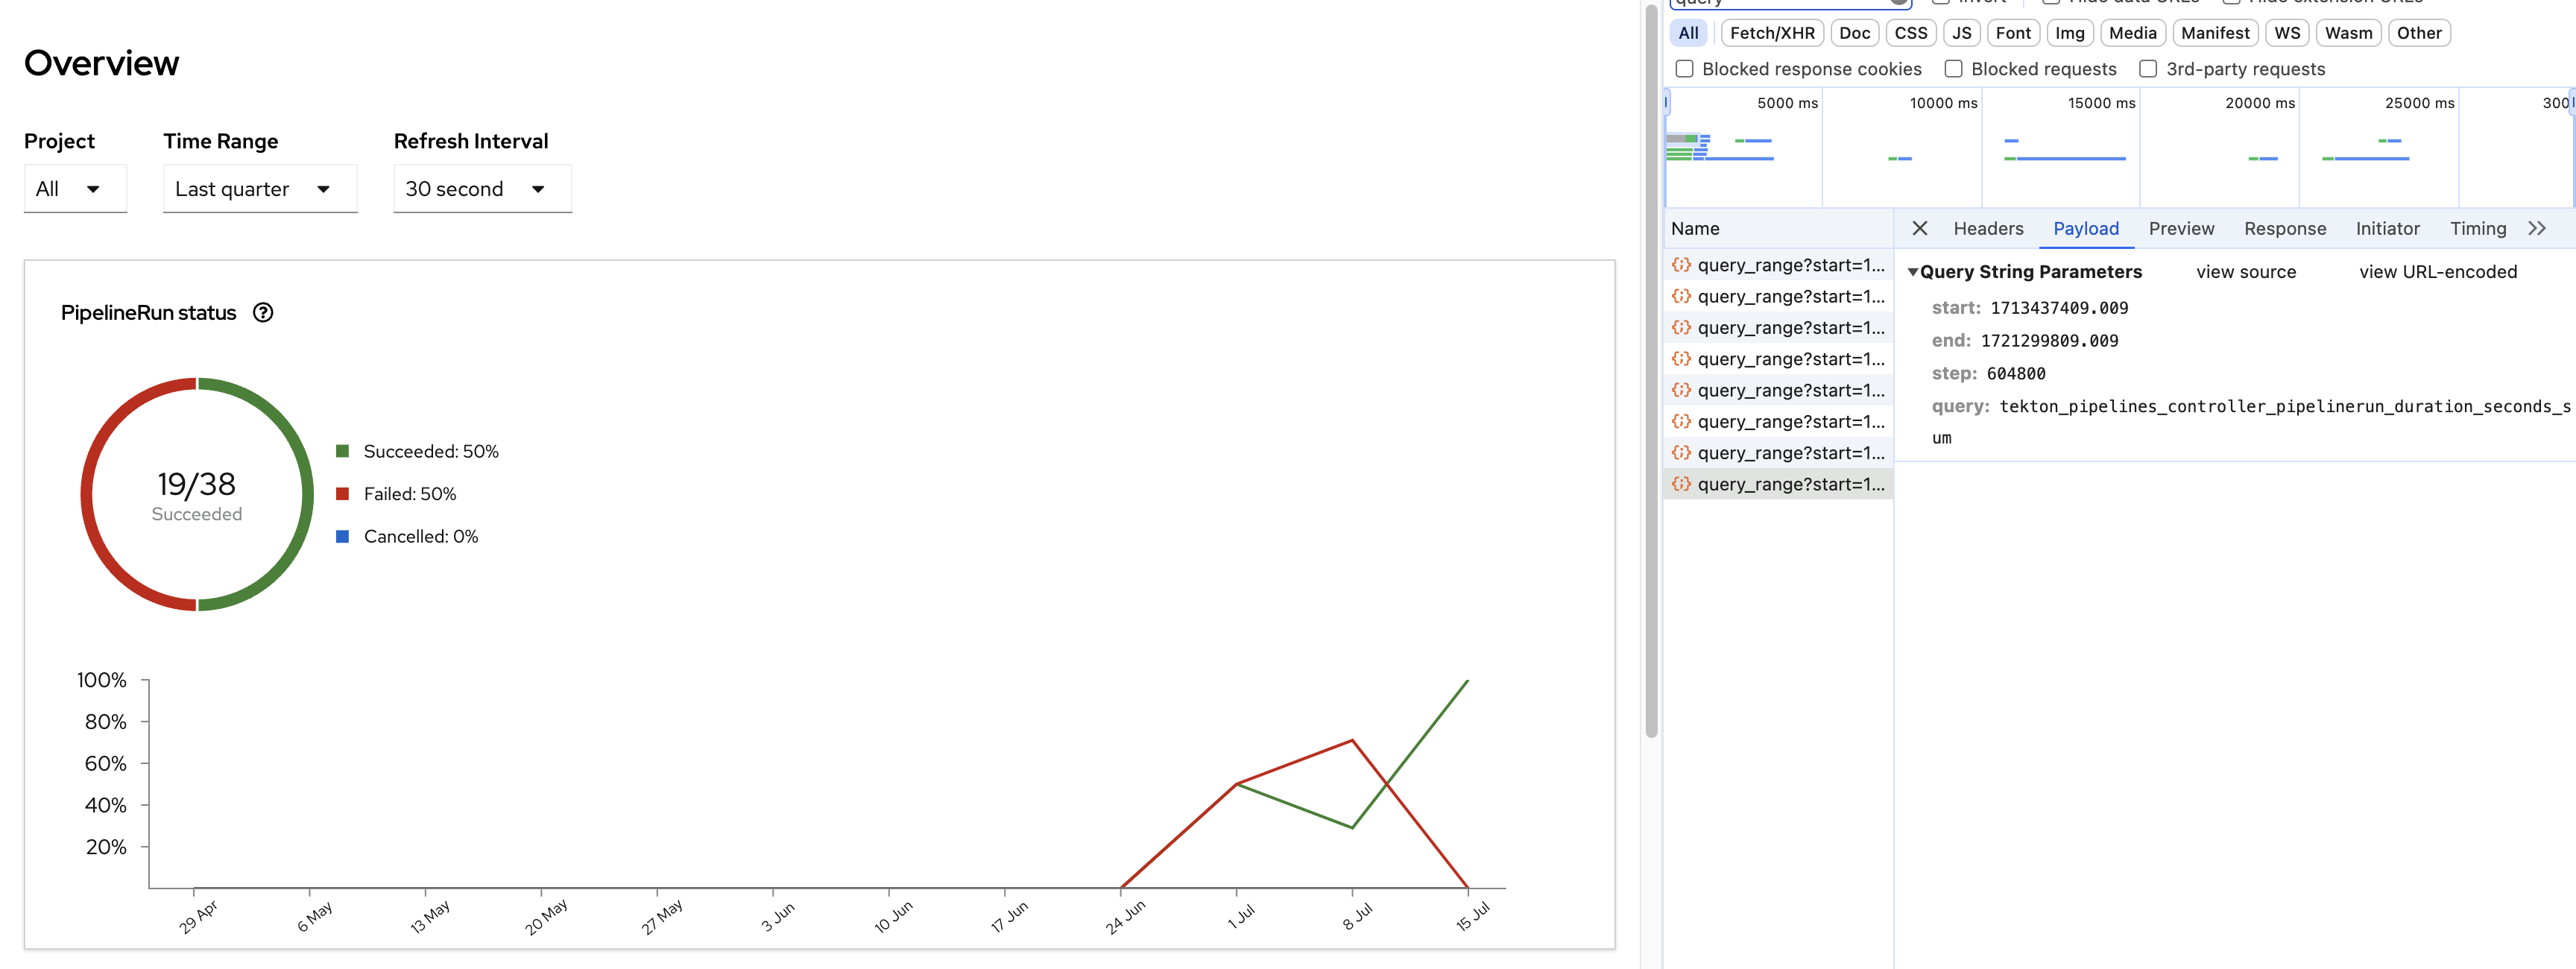
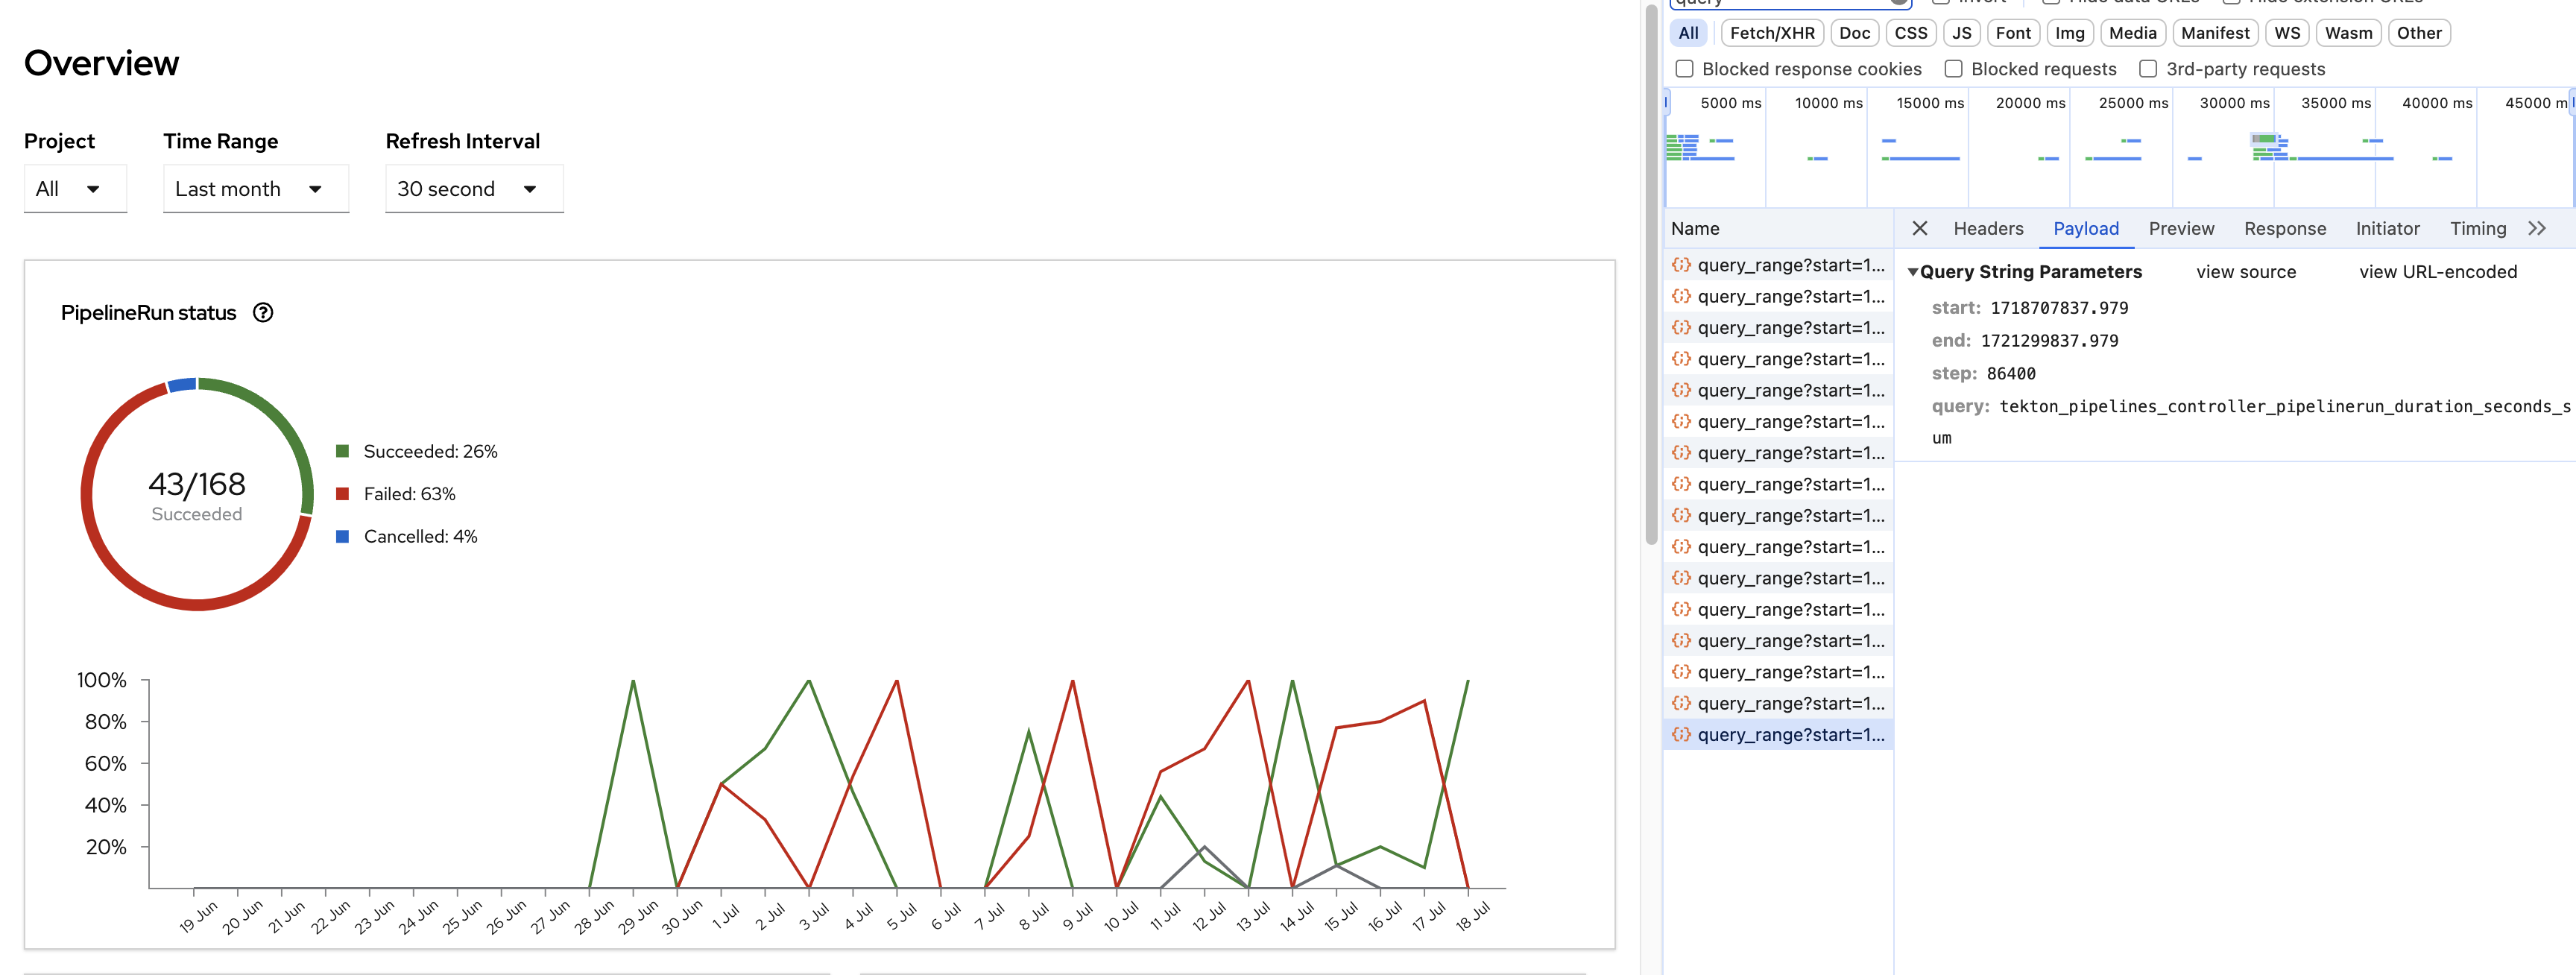
      If tried to select 2 months of data from Pipeline metrics queries, then data received is less than last one month data.(added the screenshots)

      1 month data: 
      http://localhost:9000/api/prometheus-tenancy/api/v1/query_range?start=1718707837.979&end=1721299837.979&step=86400&query=tekton_pipelines_controller_pipelinerun_duration_seconds_sum

      3 month data:
      http://localhost:9000/api/prometheus-tenancy/api/v1/query_range?start=1713437539.14&end=1721299939.14&step=604800&query=tekton_pipelines_controller_pipelinerun_duration_seconds_sum 

      There are many decrements in the metrics query output, whether it is data issue or why there are decrements?

      ex:
      http://localhost:9000/api/prometheus-tenancy/api/v1/query_range?start=1720072210.311&end=1721281810.311&step=86400&query=sum(tekton_pipelines_controller_pipelinerun_duration_seconds_count)
      gives me

      { "status": "success", "data": { "resultType": "matrix", "result": [ { "metric": {}, "values": [ [ 1720072210.311, "1" ], [ 1720158610.311, "4" ], [ 1720245010.311, "2" ], [ 1720331410.311, "1" ], [ 1720417810.311, "3" ], [ 1720504210.311, "6" ], [ 1720590610.311, "28" ], [ 1720677010.311, "11" ], [ 1720763410.311, "8" ], [ 1720849810.311, "1" ], [ 1720936210.311, "2" ], [ 1721109010.311, "12" ], [ 1721195410.311, "2" ], [ 1721281810.311, "1" ] ] } ] } }


       *

            Unassigned Unassigned
            rh-ee-lprabhu Lokananda Prabhu
            Votes:
            0 Vote for this issue
            Watchers:
            2 Start watching this issue

              Created:
              Updated: