-
Bug
-
Resolution: Cannot Reproduce
-
 Critical
-
None
-
None
-
False
-
-
False
-
-
Description of problem:
Most of the metrics defined in the docs are not being exported and some are just declared for e.g.-
# HELP tekton_pipelines_controller_running_pipelineruns_count Number of pipelineruns executing currently
# TYPE tekton_pipelines_controller_running_pipelineruns_count gauge
tekton_pipelines_controller_running_pipelineruns_count 0
Moreover, the Metrics specific labels are not being set on PipelineRuns.
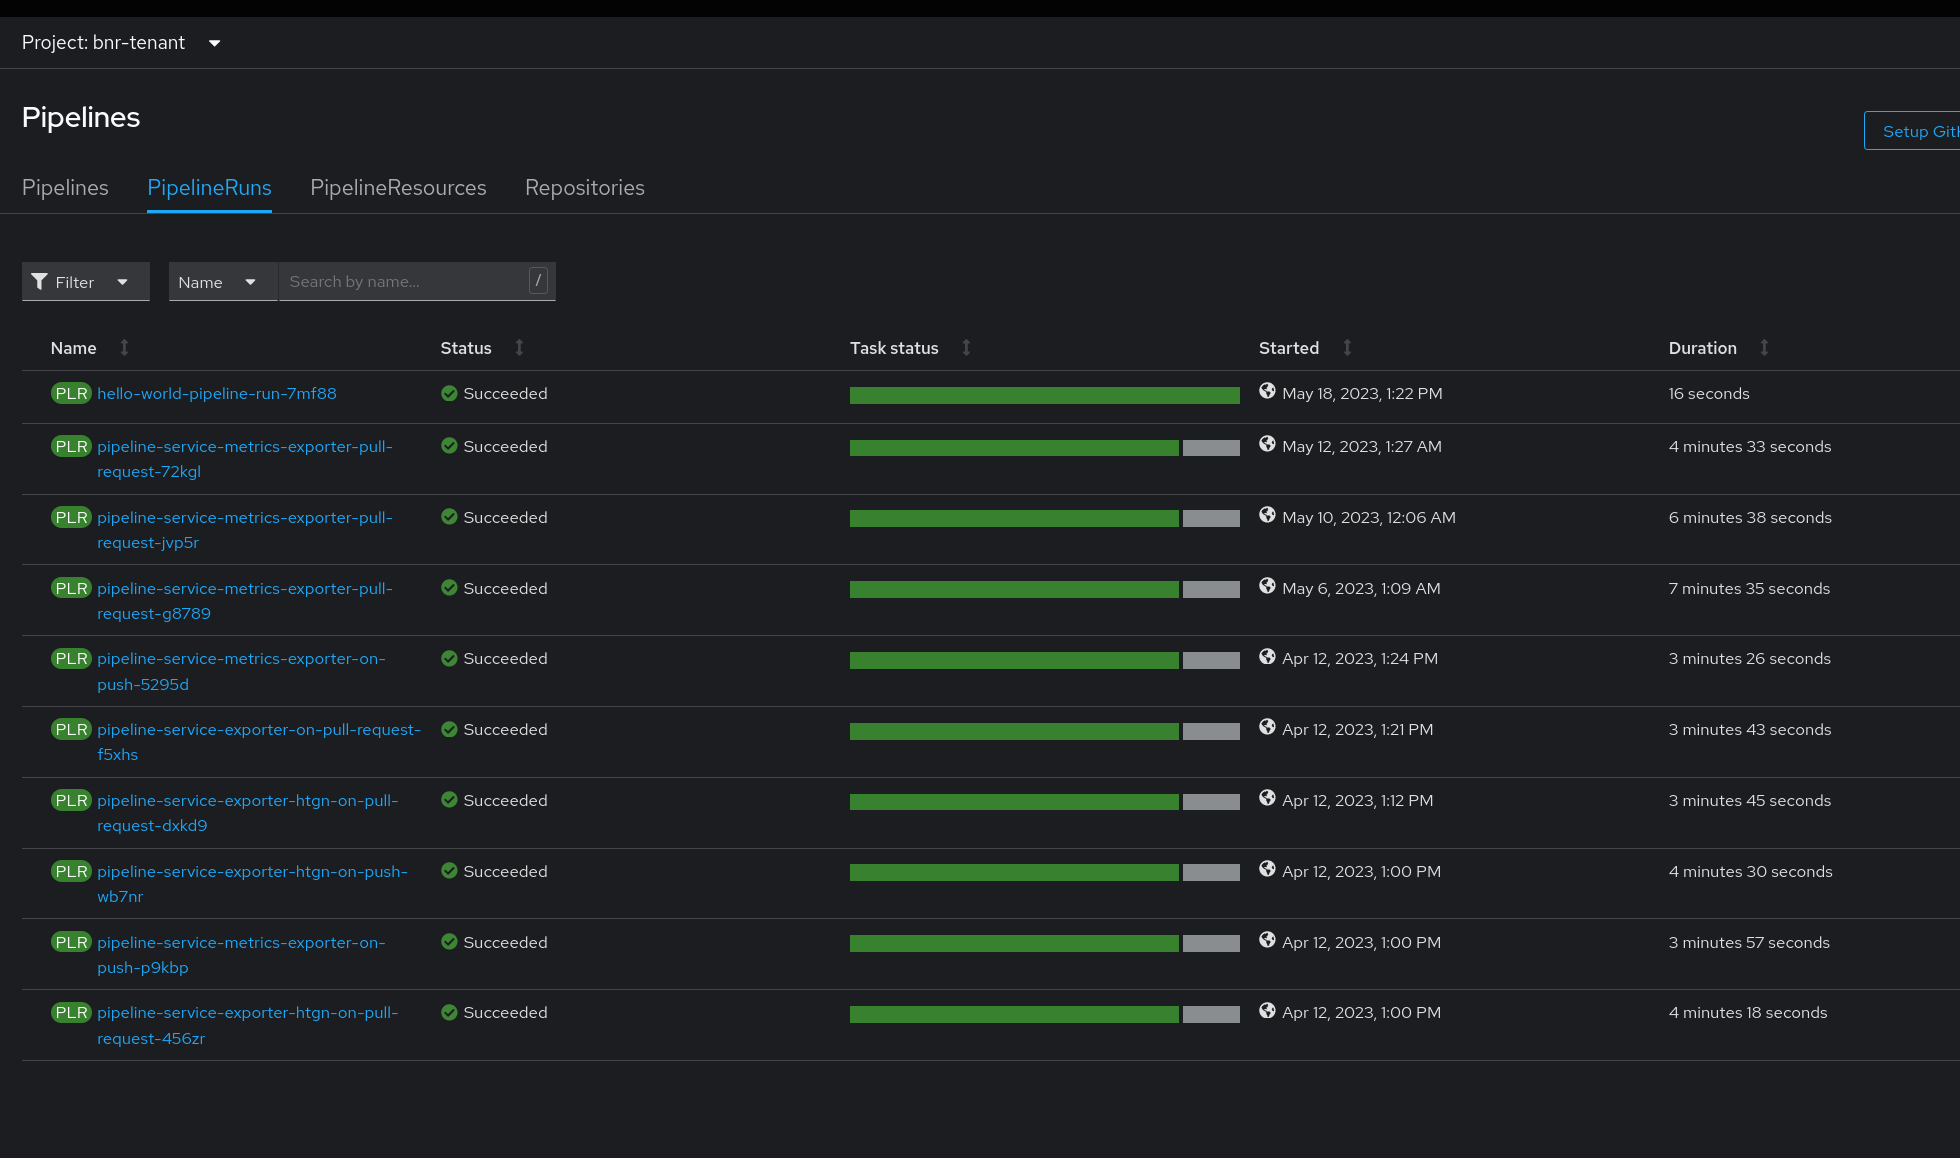
Note: This is a finding from RHTAP staging cluster which has multiple namesapces and thousands of PipelineRuns.
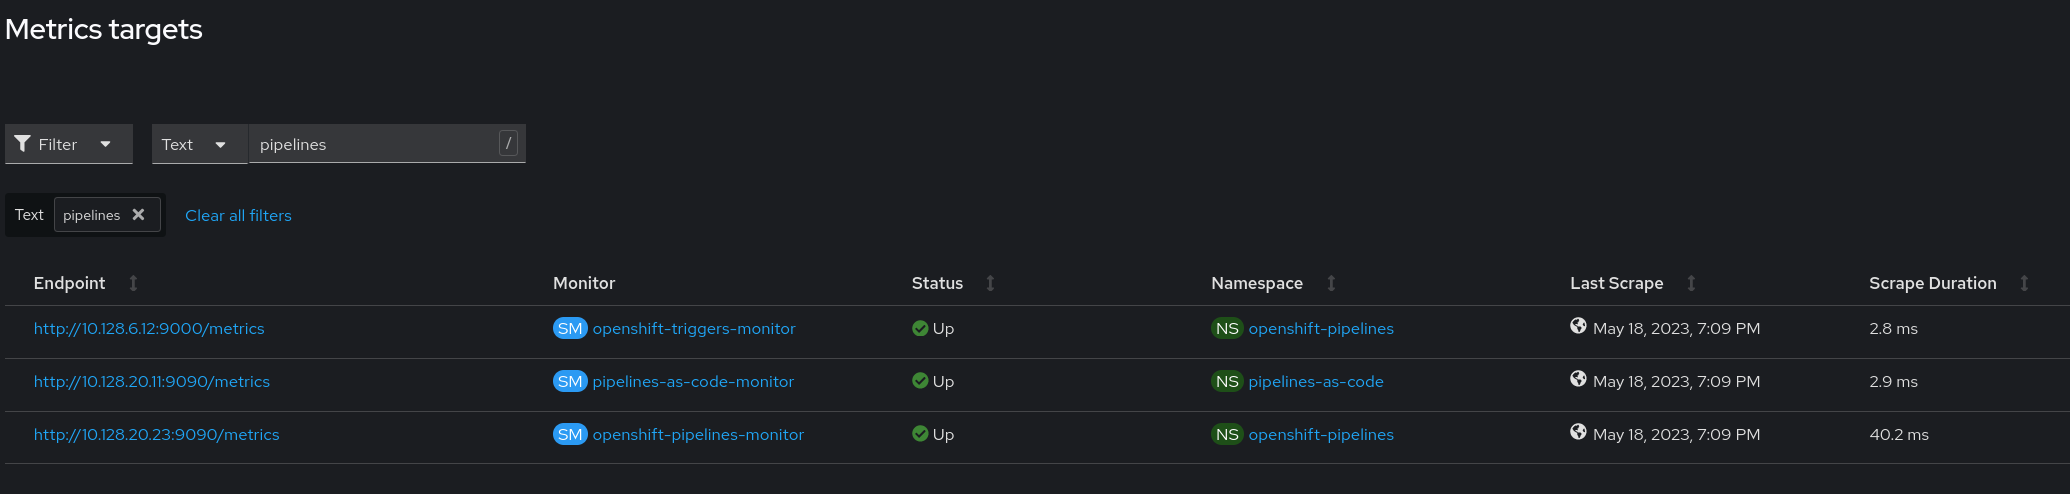
Prerequisites (if any, like setup, operators/versions):
Pipeline version - pipeline.tekton.dev/release: v0.44.2
OSP operator version - 1.10.2
apiVersion : v1
Steps to Reproduce
- Deploy OSP-1.10.2 operator.

- Do a `k port-forward -n openshift-pipelines service/tekton-pipelines-controller 9090`.
- Search for the expected metrics at `localhost:9090/metrics`.
Actual results:
1. The Grfana dashboard shows no data for an arbitrary metric point. 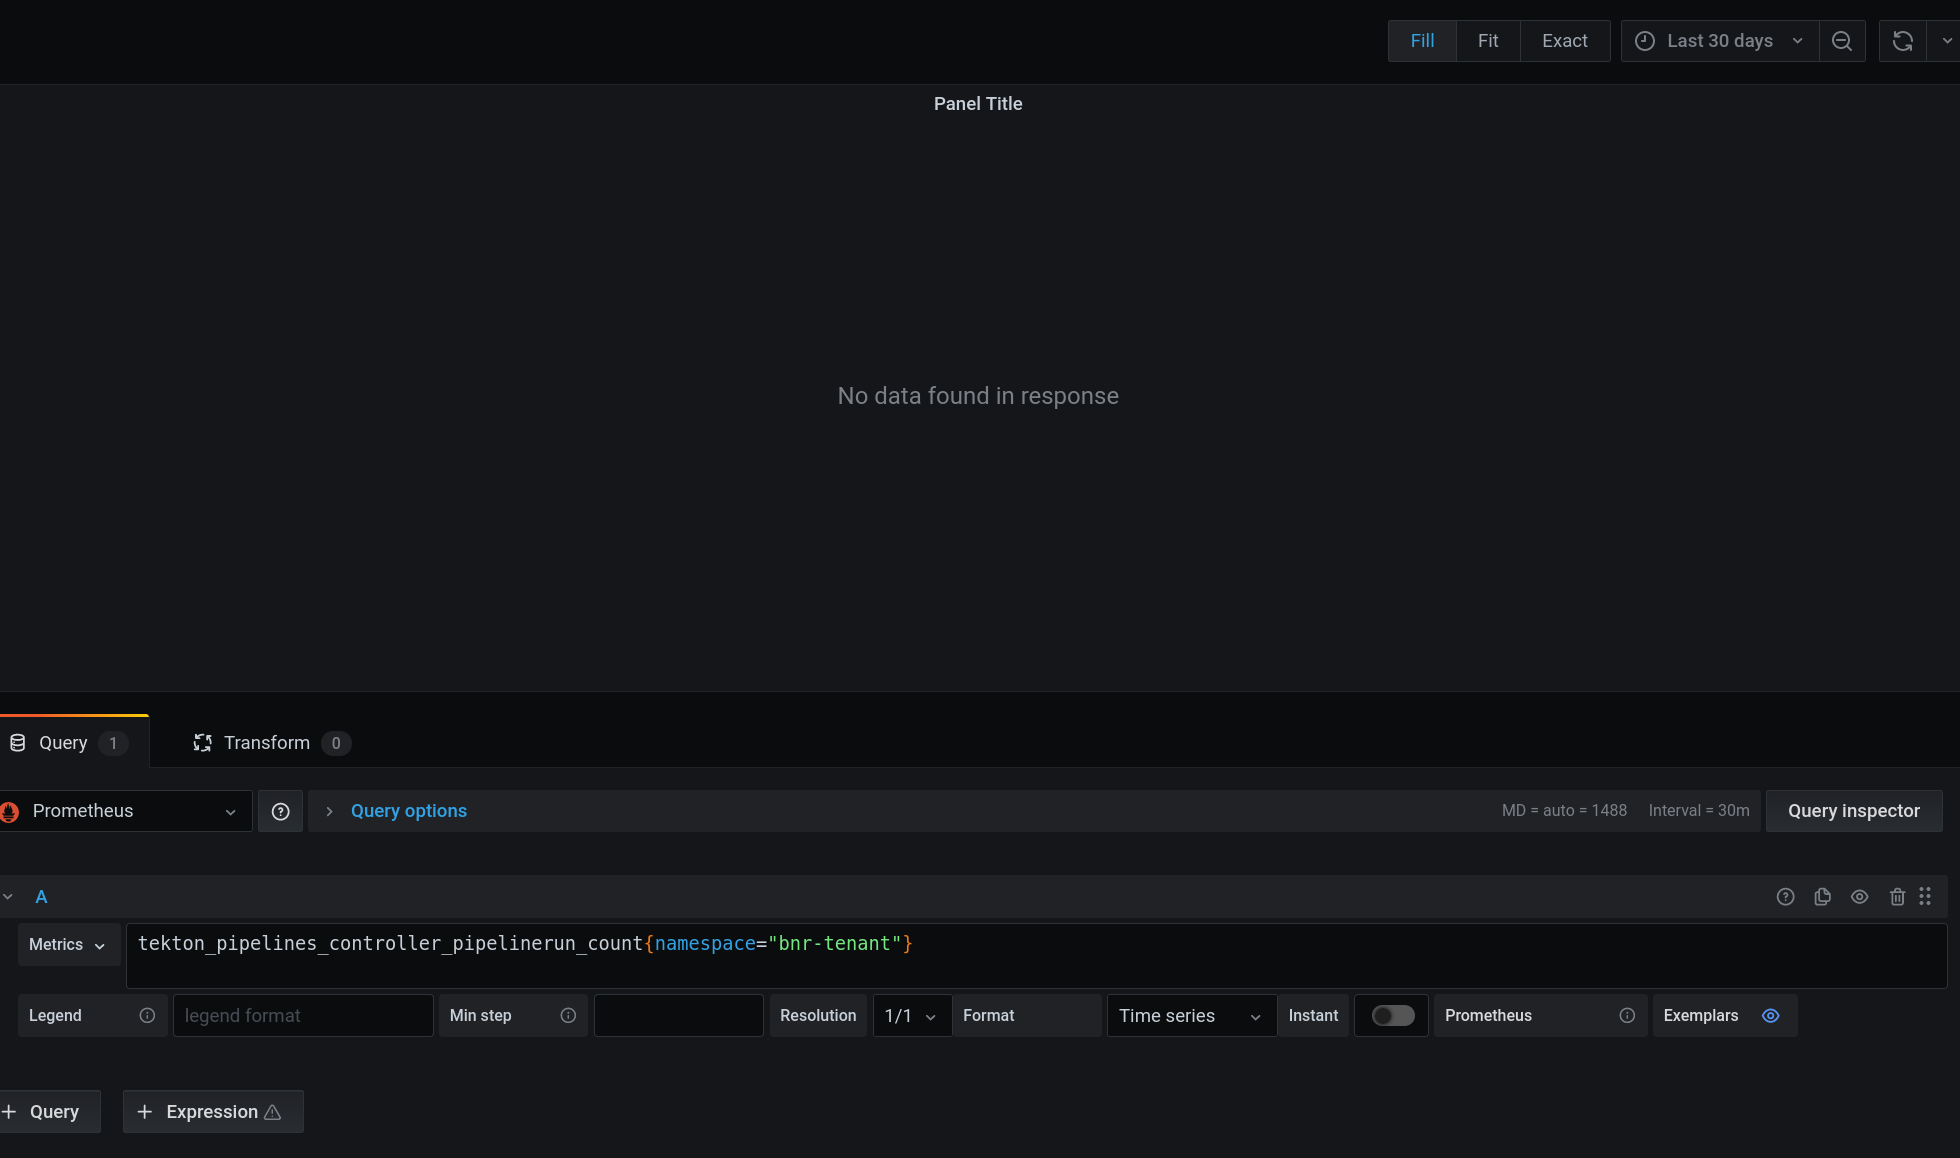 {}
{}
Expected results:
** The data should show up in the dashboard since the concerned namespace `bnr-tenant` has sufficient pipelineruns. 
Reproducibility (Always/Intermittent/Only Once):
Acceptance criteria:
Definition of Done:
All the Metrics should be exported.
Build Details:
Additional info (Such as Logs, Screenshots, etc):