-
Bug
-
Resolution: Done
-
Blocker
-
Pipelines 1.6
-
3
-
False
-
False
-
-
-
Pipelines Sprint 213, Pipelines Sprint 216, Pipelines Sprint 217, Pipelines Sprint 218, Pipelines Sprint 219, Pipelines Sprint 220, Pipelines Sprint 221, Pipelines Sprint 222, Pipelines Sprint 223
Expected behavior
Metrics page in Devconsole shows useful statistics
Actual behavior
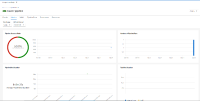
UI shows some data, probably something old (see SRVKP-1452) but definitely not all data.
Steps to reproduce
1. Install Pipelines operator and run one pipeline multiple times
2. Review "Metrics" page in Devconsole
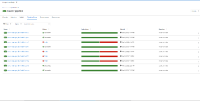
See attached screenshots
- 9 pipeline runs but only 2 are visible in Metrics.
- "PipelineRun Duration" shows wrong data - all runs finished in less than 1 minute
- "PipelineRun Duration" has wrong labels on axis x
- "TaskRun Duration" shows some data when I navigate there with mouse although the chart is empty


