-
Story
-
Resolution: Done
-
 Undefined
-
None
-
None
-
False
-
-
False
-
None
-
Testable
-
No
-
-
-
-
-
No
-
No
-
Pending
-
None
-
-
-
RHODS 1.25, RHODS 1.26, RHODS 1.27, RHODS 1.28
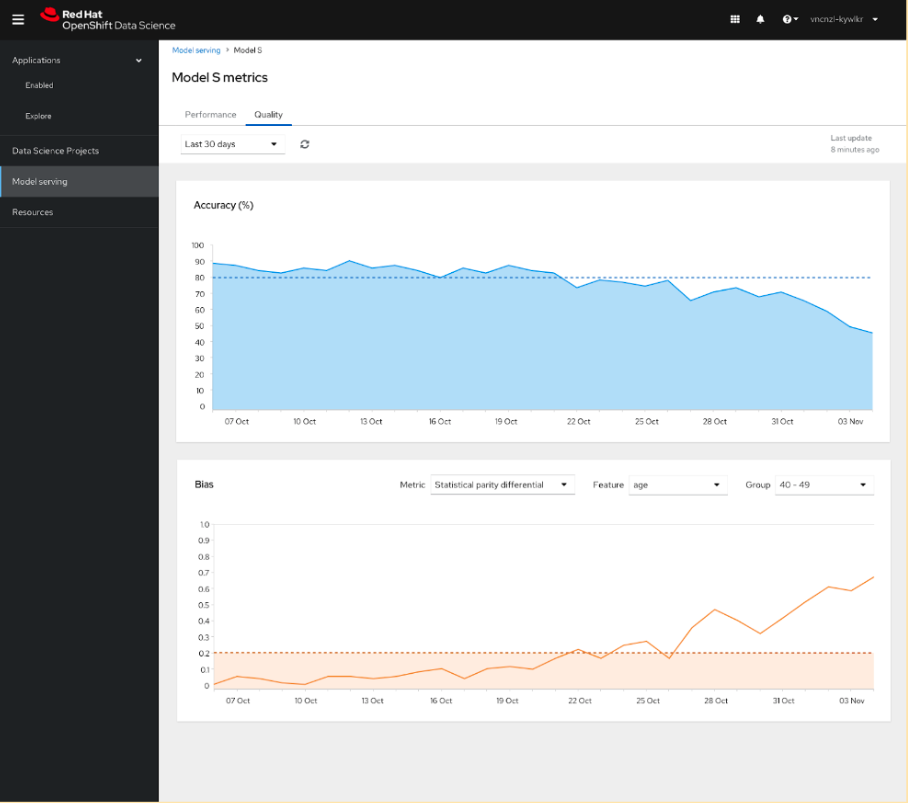
The UI will need to implement an explainability chart with custom features for phase 0.
Features:
- Tab on the inference metrics page
- 1 graph
- metrics drop down with 2 queries
- includes sub-filters for each query
- feature dropdown with types of features (options tbd); eg. age, gender, etc
- group dropdown with sub-sections of the type (options tbd); eg. age: 20-29, etc
Prerequisites:
- A deployable (even if just dev) stack to interact with a model on a dev cluster and generate the needed data to chart
- Queries determined and presented in some fashion (doc, comment, etc) with variables for feature & group – should be prometheus queries
- Understanding of what the features & group dropdown values are going to be (for hardcoding or fetching – assuming previous stack question is answered)
- is documented by
-
-

- Closed
-