-
Bug
-
Resolution: Done
-
 Normal
-
RHODS_1.20.0_GA
-
None
-
1
-
False
-
-
False
-
None
-
Testable
-
No
-
-
-
-
-
-
-
No
-
No
-
N/A
-
None
-
-
-
Moderate
Description of problem:
There was a recent development where for SM Monitoring stack was removed. However, in the SM document, we are mentioning organizing and displaying those metrics. reworded to provide less information.
Current:
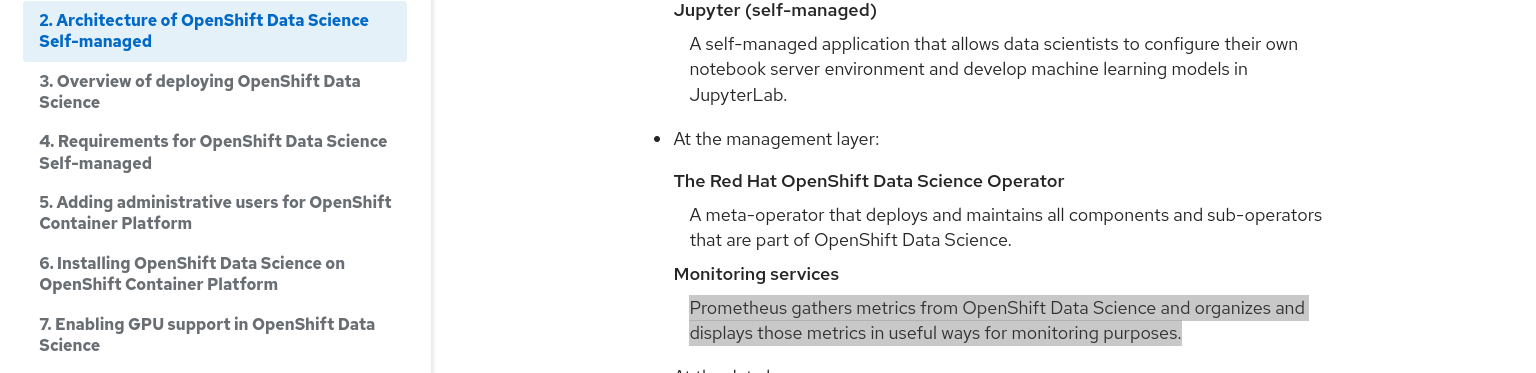
Prometheus gathers metrics from OpenShift Data Science and organizes and displays those metrics in useful ways for monitoring purposes.
Modify TO:
Prometheus gathers metrics from OpenShift Data Science for monitoring purposes.
Prerequisites (if any, like setup, operators/versions):
Steps to Reproduce
- Got to Chapter 2
- got to sub-section Monitoring services
Actual results:
Prometheus gathers metrics from OpenShift Data Science and organizes and displays those metrics in useful ways for monitoring purposes.
Expected results:
Prometheus gathers metrics from OpenShift Data Science for monitoring purposes.
Reproducibility (Always/Intermittent/Only Once):
Build Details:
Workaround:
Additional info:
- mentioned on