-
Bug
-
Resolution: Won't Do
-
 Major
Major
-
None
-
None
-
False
-
-
False
-
None
-
No
-
-
-
-
-
-
No
-
No
-
None
Description of problem:
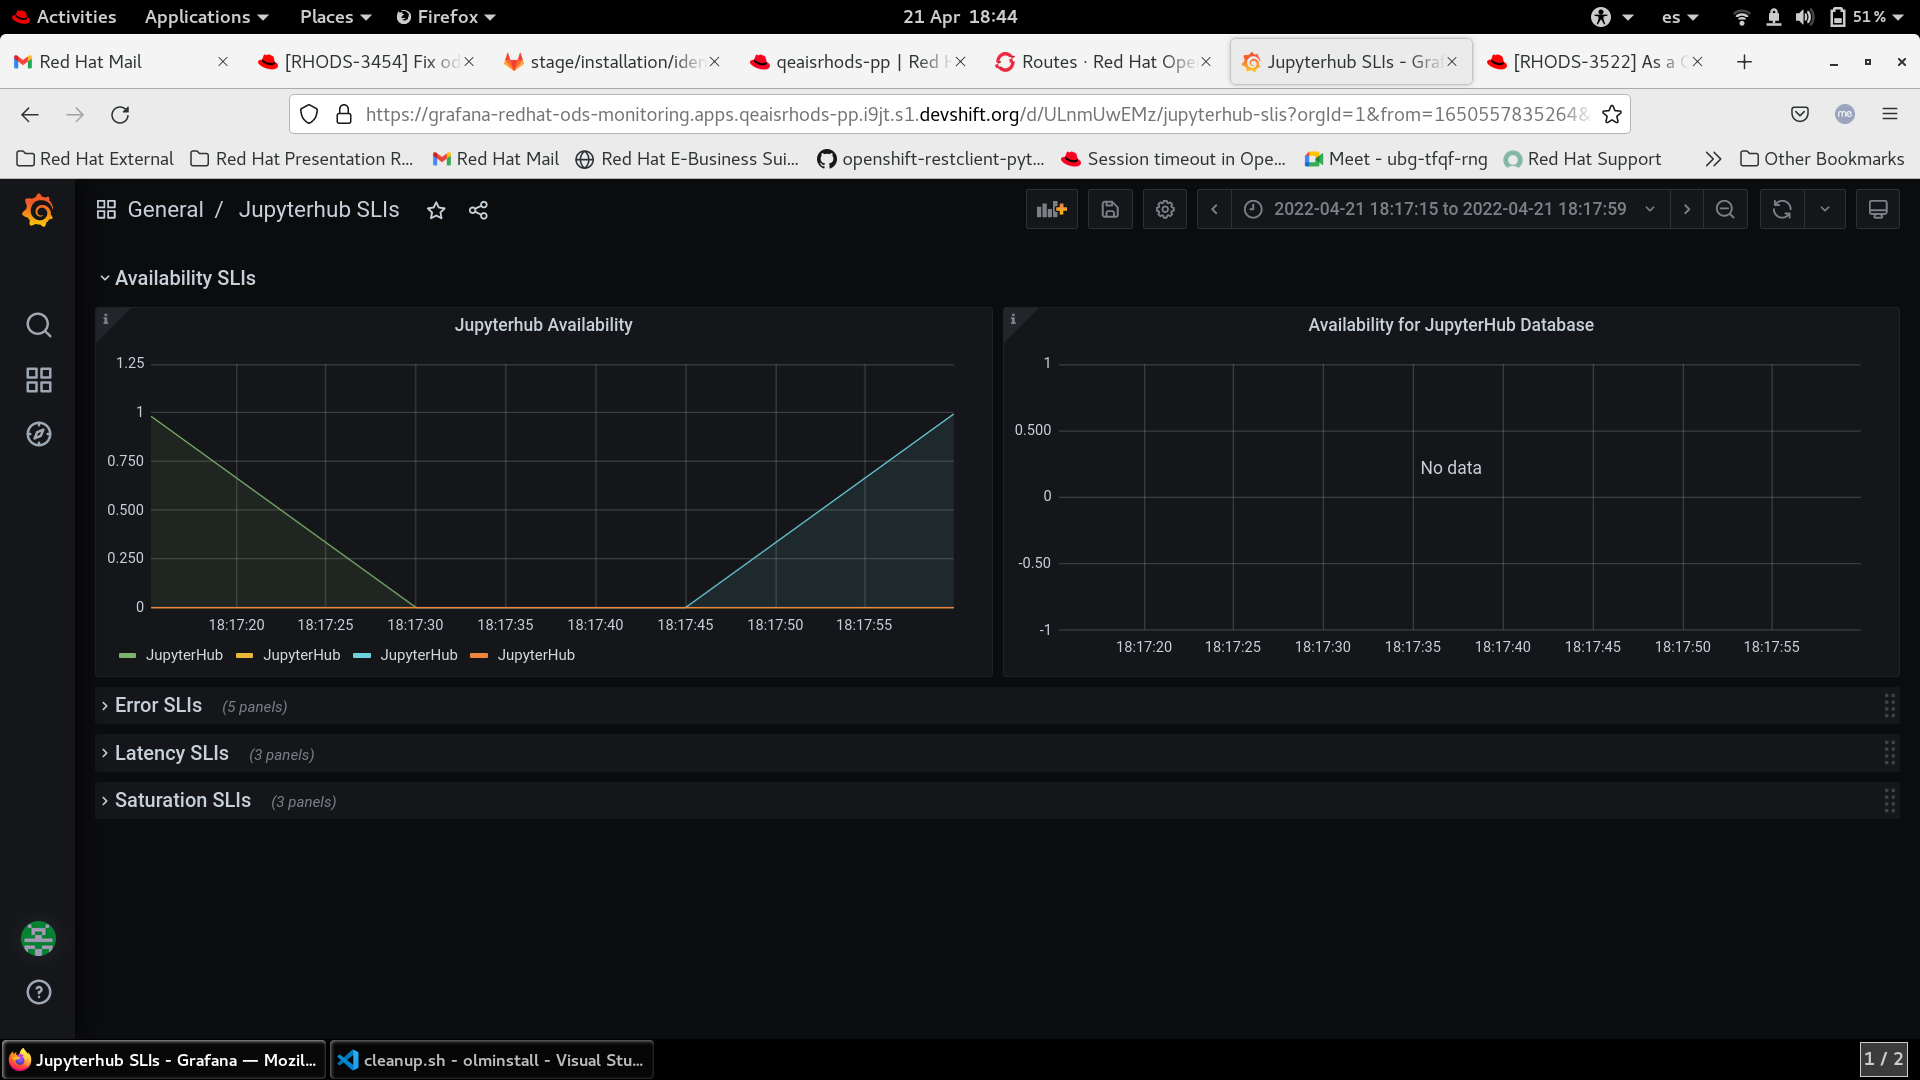
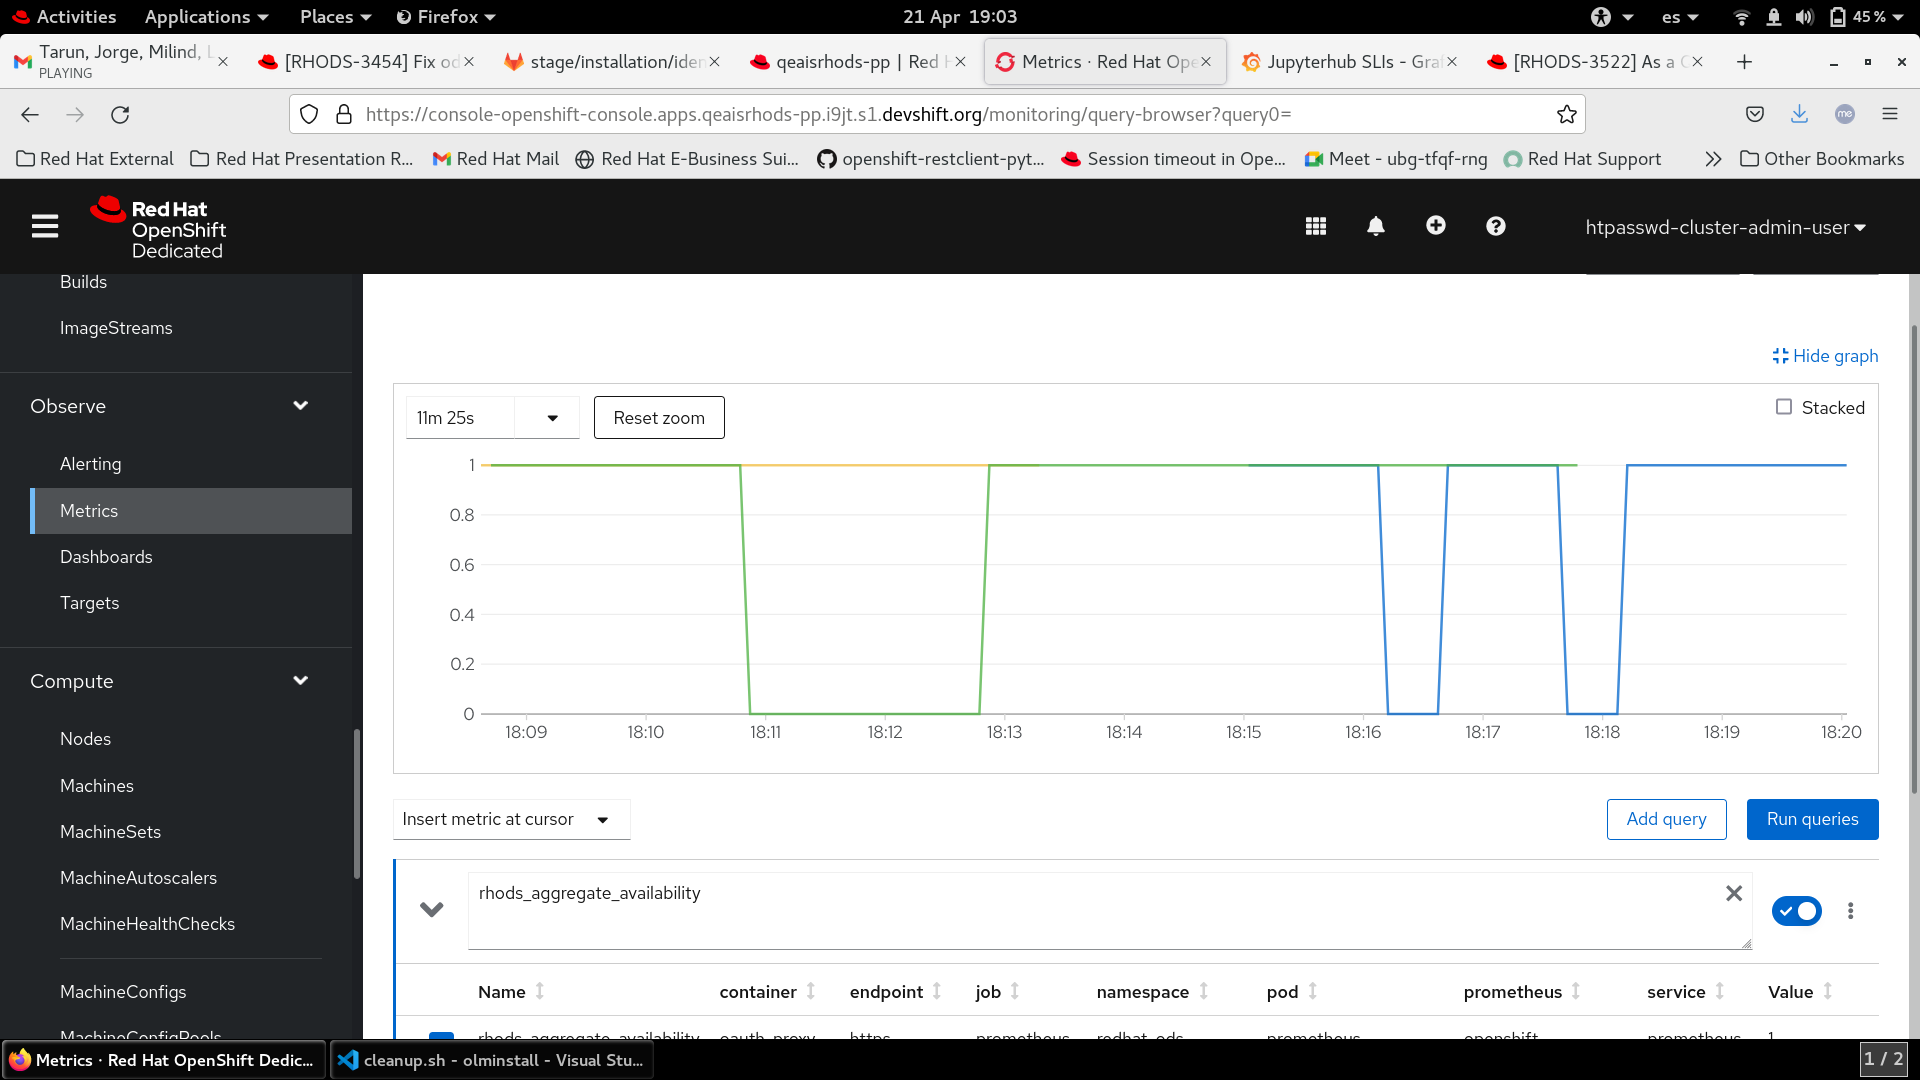
After the upgrade, while watching the unavailability in Jupyterhub, we found that Graphana shows a metric that doesn't match with the prometheus metric and manual metric of availability.
Prerequisites (if any, like setup, operators/versions):
We've found it upgrading from v180-14 to v190-7
Steps to Reproduce
- Upgrade RHODS
- Comparing the unavailability with Prometheus, manually by counting second and Graphana metric
Actual results:
Graphana shows an unavailability different than the unavailability shown in Prometheus.
Expected results:
Find the same unavailability time in both tools in the upgrade
Reproducibility (Always/Intermittent/Only Once):
Always
Build Details:
Workaround:
Additional info:
- is related to
-
RHODS-3649 Delete RHODS Monitoring Stack Grafana
-

- Closed
-